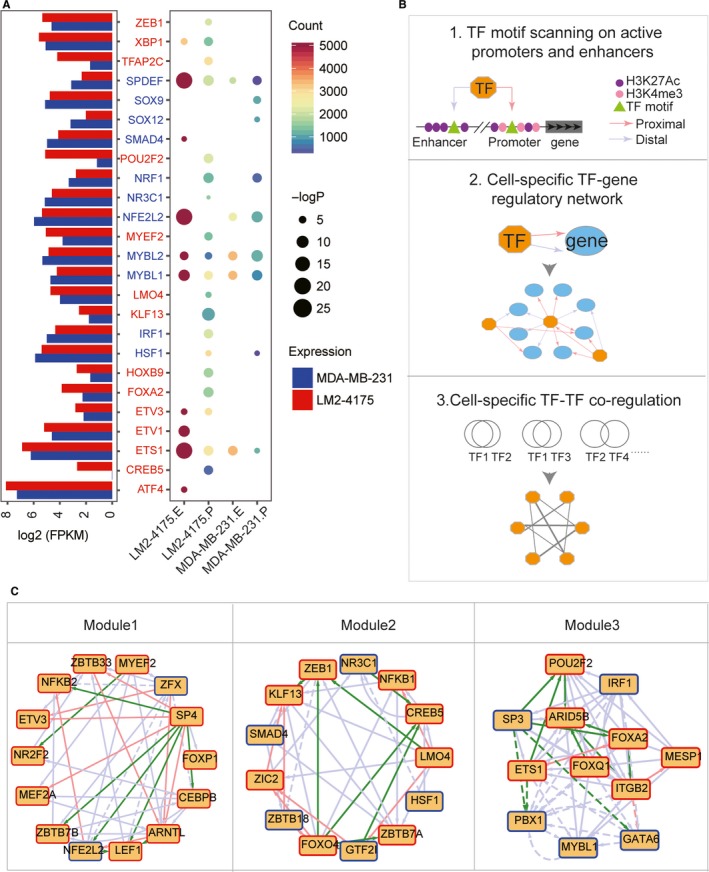
Figure 5.

Motif enrichment analysis and identification of regulatory network. (A) Motif enrichment analysis of specifically active promoters and enhancers in MDA‐MB‐231 and LM2‐4175. The point colour indicates the number of promoters/enhancers containing the certain motif. The point size indicates the –log P‐value of enrichment analysis. Font colour indicates the expression changes of transcription factors (TFs), red for up‐regulated and blue for down‐regulated TFs. LM2‐4175.E: specific enhancers of LM2‐4175; LM2‐4175.P: specific promoters of LM2‐4175; MDA‐MB‐231.E: specific enhancers of MDA‐MB‐231; MDA‐MB‐231.P: specific promoters of MDA‐MB‐231. (B) Framework for identification of master regulatory network and TF‐TF interaction. (C) Modules of the regulatory network. Only TFs were shown here because of the limited space. The downstream target genes were shown in Table S6. The node border was used to present the expression changes, where the red border indicates up‐regulated genes and the blue border indicates down‐regulated genes. Red edges represent the proximal (promoter) regulation, blue edges represent the distal (enhancer) regulation and green edges represent that both proximal and distal regulations exist. Solid edges represent the LM2‐4175‐specific regulation, and dashed edges represent the MDA‐MB‐231‐specific regulation
