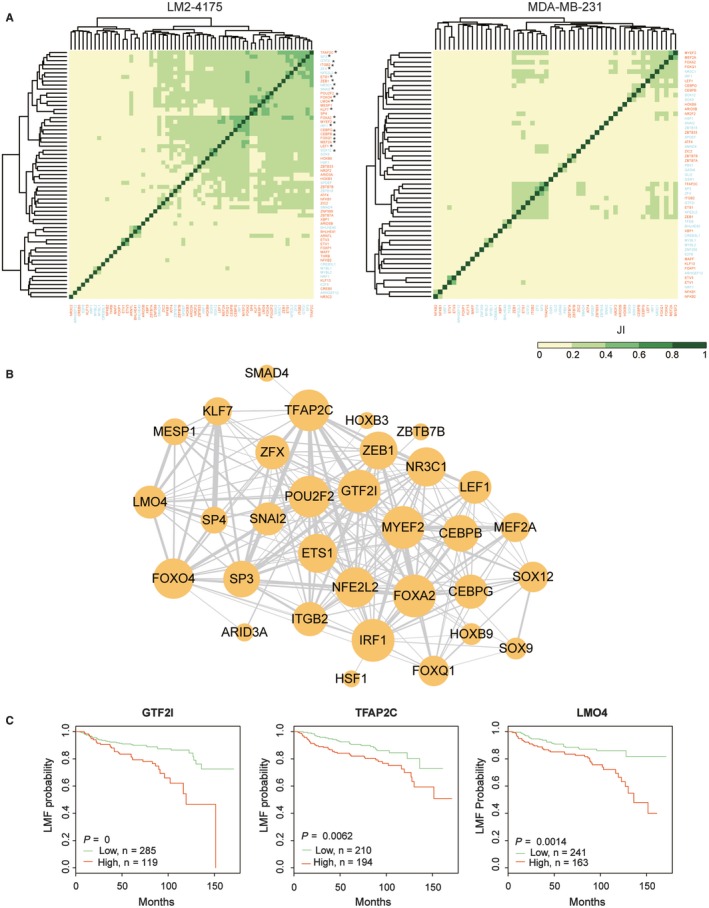
Figure 6.

Cooperations of multiple transcription factors (TFs). (A) TF‐TF cooperation was quantified by Jaccard index (JI) score. The colour in heatmap represents the JI score. Left panel: TF‐TF cooperation on specifically active cis‐elements (promoters and enhancers) of LM2‐4175 cell line; right panel: TF‐TF cooperation on specifically active cis‐elements (promoters and enhancers) of MDA‐MB‐231 cell line. TFs marked by asterisk have tight correlation (JI > 0.3) with more than ten other factors. Font colour indicates the expression changes of TFs, red for up‐regulated and blue for down‐regulated TFs. (B) Specific TF‐TF cooperation network in LM2‐4175 cell line. Node size was proportional with the number of neighbours. Edge width was proportional with Jaccard index between two TFs. (C) Lung metastasis free survival analysis of regulators. Other significant regulators were shown in Figure S6
