Figure 6.

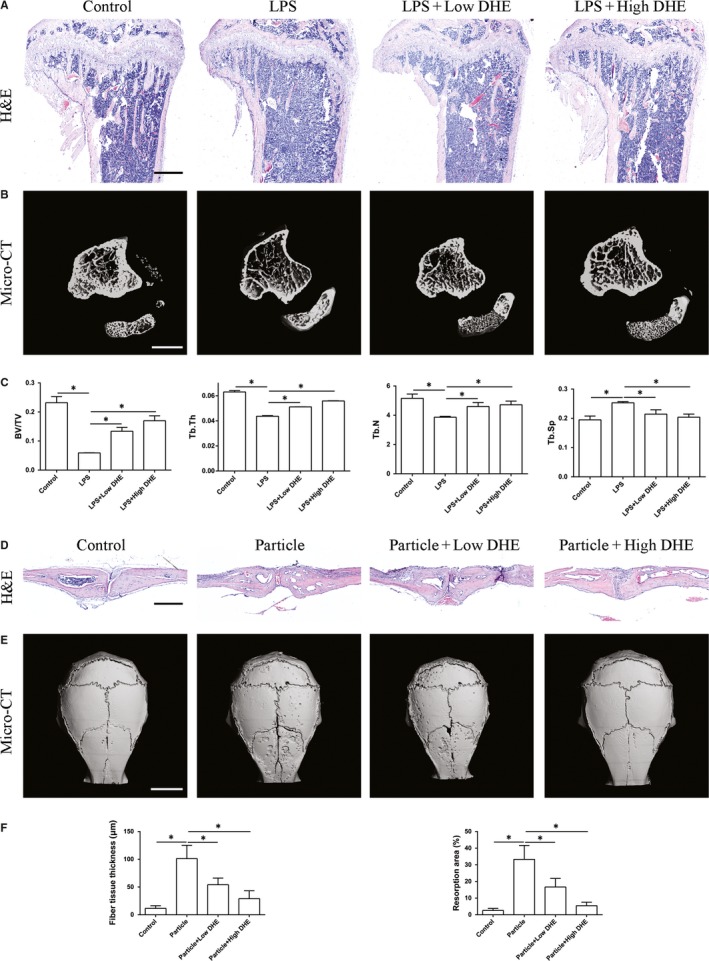
Dehydrocostus lactone (DHE) mitigated lipopolysaccharide (LPS)‐induced bone loss and particle‐induced calvarial osteolysis in vivo. A, Haematoxylin and eosin staining of representative sections of the proximal tibia in each group. Scale bar = 500 μm. B, Representative three‐dimensional micro‐CT reconstruction images of each group. Scale bar = 2 mm. C, Micro‐CT analyses of bone volume/tissue volume, trabecular number, trabecular thickness and trabecular separation in the region of interest. D, Haematoxylin and eosin staining of representative sections of the calvaria in each group. Scale bar = 500 μm. E, Representative three‐dimensional micro‐CT reconstruction images of each group. Scale bar = 3 mm. F, Quantification of fibre tissue thickness above the resorption area and resorption area of each group. Data are expressed as means ± SD. *P < 0.05 among groups
