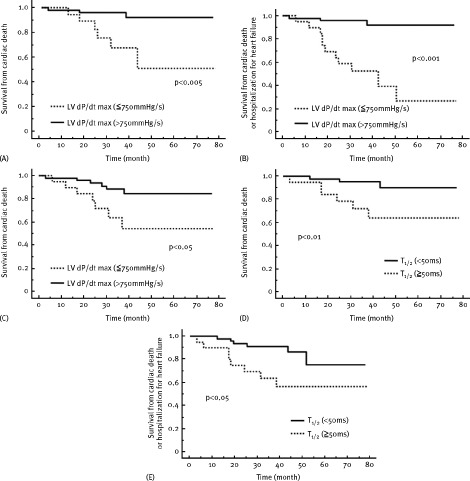
Figure 1.

Kaplan‐Meier estimates of the time to various clinical end points; (A,D) cardiac death, (B,E) cardiac death or hospitalization for heart failure, (C) all‐cause death. Patients were stratified according to (A,B,C) peak positive LV dP/dt and (D,E) isovolemic LV pressure half‐time (T1/2)
