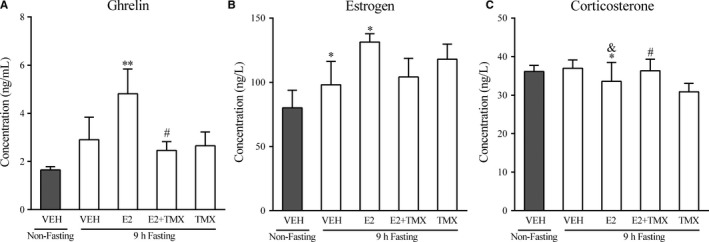
Figure 4.

Effects of acute 9 h fasting, E2 and TMX, on serum ghrelin, E2 and CORT levels. Columns represent mean ± SEM. * P < 0.05; ** P < 0.01 compared with the non‐fasting control (vehicle) group. & P < 0.05 compared with the fasting group. # P < 0.05 compared with the E2 + fasting group. VEH: vehicle; E2: 17 β‐estradiol; TMX: tamoxifen
