
Figure 5.
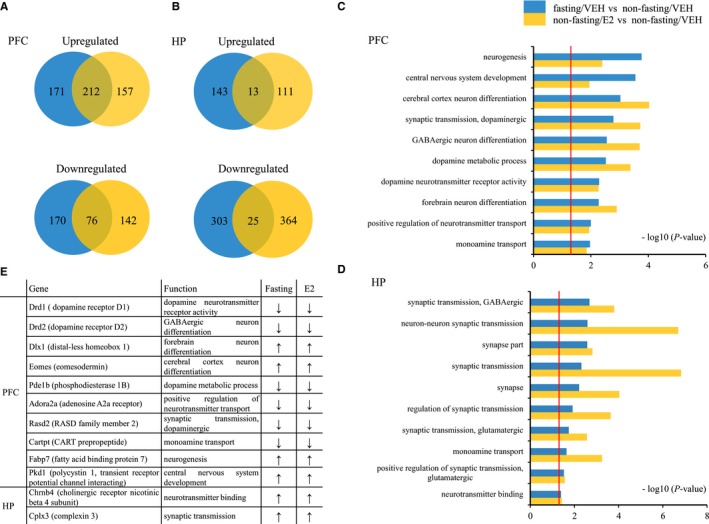
DEGs and Gene Ontology (GO) analyses of fasting and E2 treatment in the PFC and HP in mice. Both treatments were compared with the non‐fasting control (vehicle) group. N = 3 per group. Venn diagrams in A and B representing overlap in significantly up‐regulated or down‐regulated mRNAs in the PFC (A) and HP (B) treated with fasting or E2 in mice. Bar graphs at right show the neurological functions that are enriched in DEGs after fasting and E2 treatment in the PFC (C) and HP (D) in mice. The threshold of DEGs and GO enrichment was set to P value ≤ 0.05, red line in C and D indicates P = 0.05. Table in E shows the representative genes that were up‐ or down‐regulated in the PFC and HP by fasting or E2 treatment. The threshold was set to P ≤ 0.05, fold change >1.3 (↑) or fold change <0.83 (↓). PFC: prefrontal cortex; HP: hippocampus; E2: 17 β‐estradiol; VEH: vehicle.