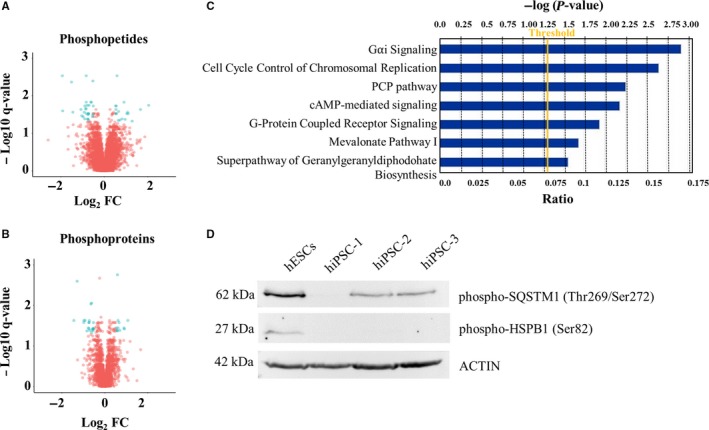
Figure 2.

A, Volcano Plot representing differentially abundant phosphopetides between hiPSC‐1 and hESCs. B, Volcano Plot of differentially abundant phosphoproteins between hiPSC‐1 and hESCs. The x‐axis specifies the Log2 fold change (Fc) and the y‐axis specifies the q‐value negative logarithm in base 10. Differentially expressed phosphopeptides and phoshoproteins are represented as blue dots, while the unchanged ones are shown as red dots. C, Ingenuity Pathway Analysis showing signalling pathways enriched by the differentially expressed phosphoproteins. D, Western blot analysis of phospho‐HSPB1 (Ser82) and phospho‐SQSTM1 (Thr269/Ser272), both down‐regulated in hiPSCs (‐1, ‐2, and ‐3) vs hESCs. hESCs, human embryonic stem cells; hiPSCs, human induced pluripotent stem cells
