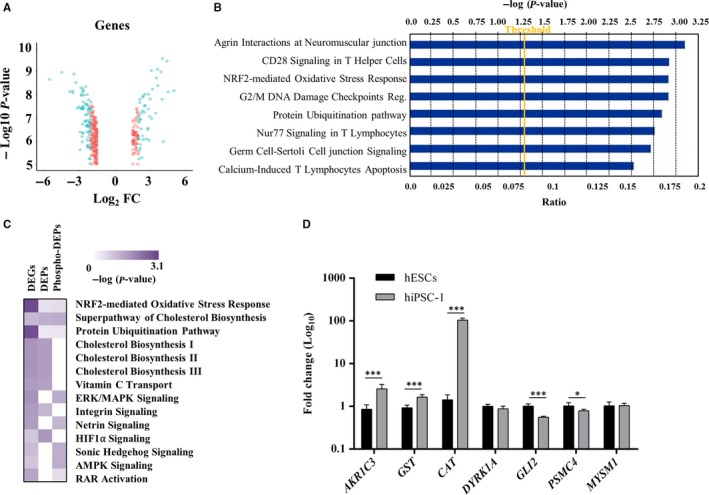
Figure 3.

A, Volcano plot representing differentially expressed genes (blue dots) between hiPSC‐1 and hESCs; the unchanged genes are shown as red dots. The x‐axis specifies the Log2 fold change (Fc) and the y‐axis specifies the q‐value negative logarithm in base 10. B, Top canonical signalling pathways uncovered by Ingenuity Pathway Analysis. C, Heat Map representing color‐coded networks derived from the integrative transcriptomic, whole proteomic and phosphoproteomic analysis of hiPSC‐1 and hESCs (the colour intensity scale is proportional to the statistical significance of a specific pathway enriched in each dataset, – log (P‐value). D, Quantitative real‐time polymerase chain reaction analysis of the NRF2‐mediated Oxidative Stress Response (AKR1C3, GST, CAT), Sonic Hedgehog (DYRK1A and GLI2) and Protein Ubiquitination pathways (PSMC4 and MYSM1) ‐ associated genes. Expression values are normalized to GAPDH and relative to hESCs. Data are mean ± SD from three independent experiments (*P < 0.05, ***P < 0.001, t‐test). hESCs, human embryonic stem cells; hiPSCs, human induced pluripotent stem cells
