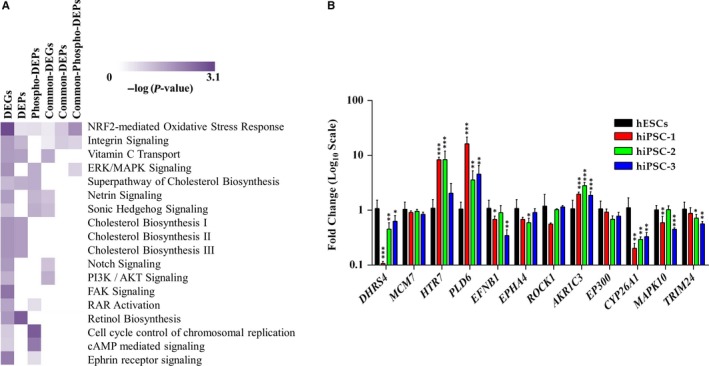
Figure 4.

A, Heat Map representing signalling pathways exclusively and commonly enriched in our dataset and in the one coming from Phanstiel et al. B, Quantitative real‐time polymerase chain reaction analysis of some target genes associated with the exclusively enriched pathways. Expression values are normalized to GAPDH and relative to human embryonic stem cells. Data are mean ± SD from three independent experiments (*P < 0.05, **P < 0.01, ***P < 0.001, t‐test)
