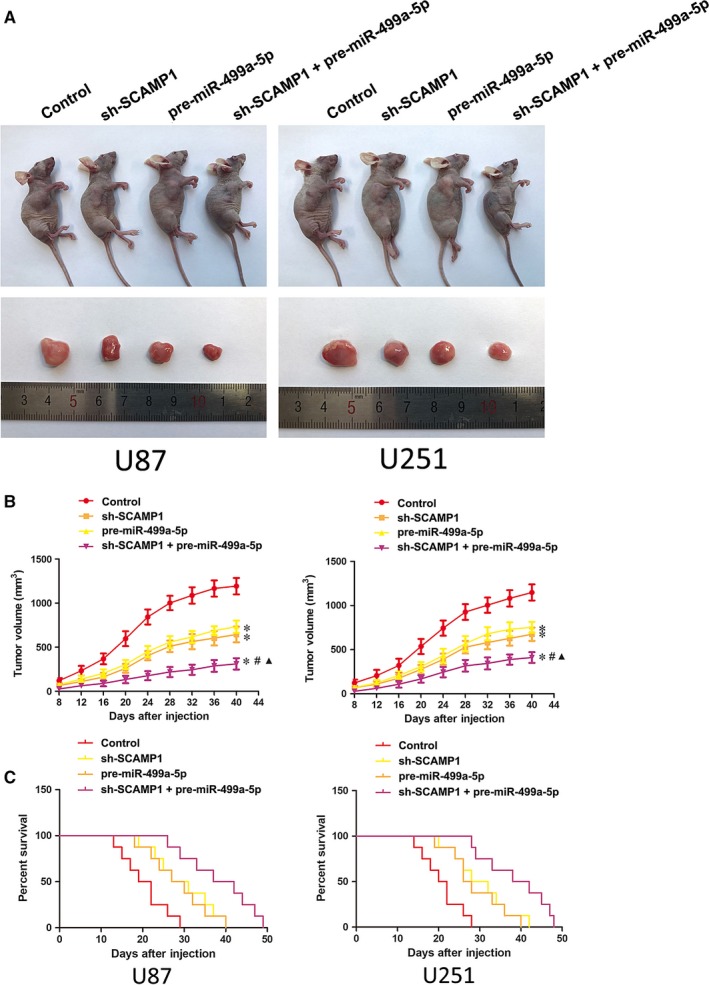
Figure 7.

In vivo study. (A) The nude mice and the sample tumours from respective groups were shown. (B) Tumour xenograft growth curves in subcutaneous implantation assay were shown. Tumour volume was calculated every 4 days after injection and the tumour was resected after 40 days. Data represent mean ± SD (n = 10, each group). *P < 0.05 vs control group, # P < 0.05 vs sh‐SCAMP1 group, ▲ P < 0.05 vs pre‐miR‐499a‐5p group. (C) Survival curves from representative nude mice injected into the right striatum in orthotopic inoculations assay were shown (n = 10, each group). P < 0.05 (sh‐SCAMP1, pre‐miR‐499a‐5p and sh‐SCAMP1 + pre‐miR‐499a‐5p groups vs control group)
