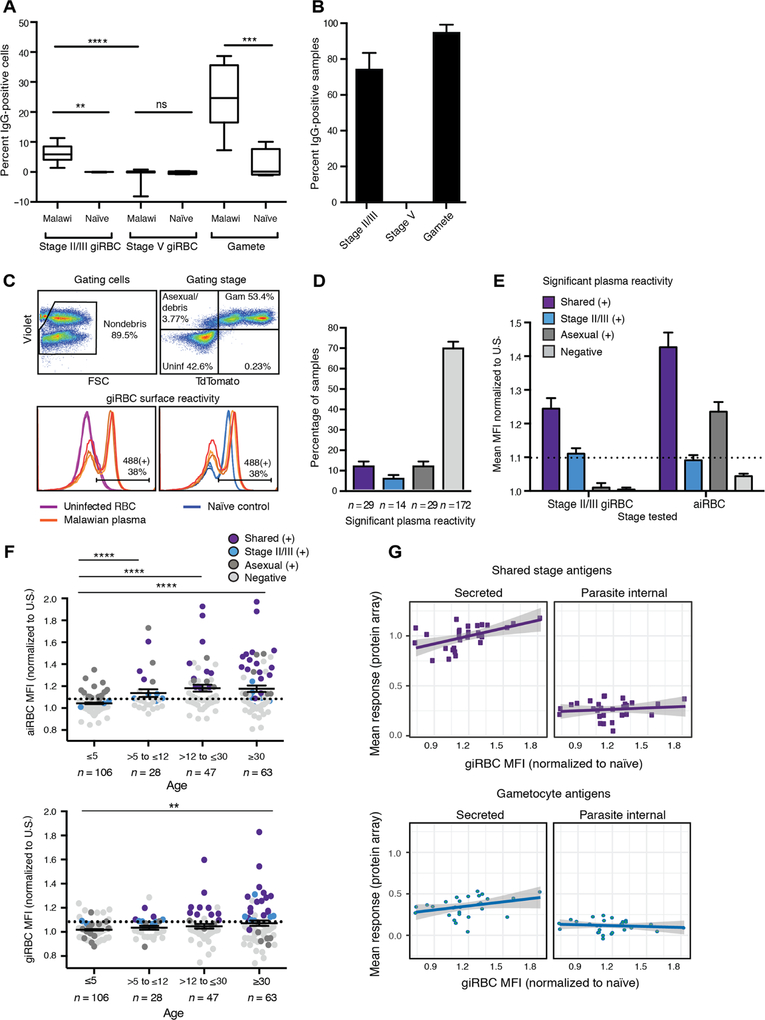
Fig. 2. Immune responses target the immature but not the mature giRBC surface.
(A and B) Results from a pilot flow cytometry study testing reactivity of 24 Malawian plasma samples (22 from Chikhwawa, a high-transmission region, and 2 from Ndirande, a low-transmission region) and 5 naïve controls against stage II/III and stage V gametocytes and gametes. Positive surface reactivity (>3 SDs above mean of naïve controls) is shown both as percentage of significantly positive samples of all those tested (A) and percentage of positive cells among those incubated with an individual plasma sample (B). (C) Schematic for gating strategy of giRBC surface detection in 244 Malawian plasma samples by flow cytometry. IgG positivity is determined using the Pf2004_164/TdTom line that allows selection of the parasite population (positive for DNA dye) and TdTomato (positive for gametocytes). Top: Cells are first gated for live cells and single cells by forward and side scatter (FSC) (left). After debris is gated out, quadrant gates separate gametocytes (Violet+/TdTomato+), asexual/lysed cells/debris (Violet+/TdTomato−), and uninfected cells (right). Bottom: Alexa Fluor 488 surface fluorescence (human IgG secondary antibody conjugates) is compared between uninfected cells and gametocytes (left) and between infected cells incubated with naïve controls and Malawian plasma samples (right). Technical replicates are shown as individual lines. (D and E) Positive recognition of aiRBCs and stage II/III giRBCs (determined by t tests comparing Malawi samples to naïve U.S. controls using the Holm-Sidak method with α = 0.05) by 244 Malawian plasma samples is shown as prevalence (D) and as significant fold change in Alexa Fluor 488 median fluorescence compared to naïve controls (E). The threshold for specific positive reactivity was set to 1.1 based on the highest level of nonspecific reactivity (i.e., reactivity to aiRBCs of human plasma significantly positive for stage II/III giRBC but negative for aiRBC). (F) Correlation of human plasma recognizing aiRBCs (top) and giRBCs (bottom) by flow cytometry with age. MFI, median fluorescence intensity. (G) Correlation of antigen responses by peptide array versus surface recognition by flow cytometry. For the same set of Malawi plasma samples, normalized peptide array signal intensities were averaged across all shared stage antigens (top) or gametocyte-specific antigens (bottom). These mean responses were correlated with giRBC recognition by flow cytometry as measured by median fluorescence (Alexa Fluor 488) fold change compared to naïve controls. Overall, mean responses of shared secreted antigens are significantly correlated with giRBC recognition (P = 0.004), whereas the other correlations are nonsignificant. **P < 0.01, ***P < 0.001, and ****P < 0.0001.

