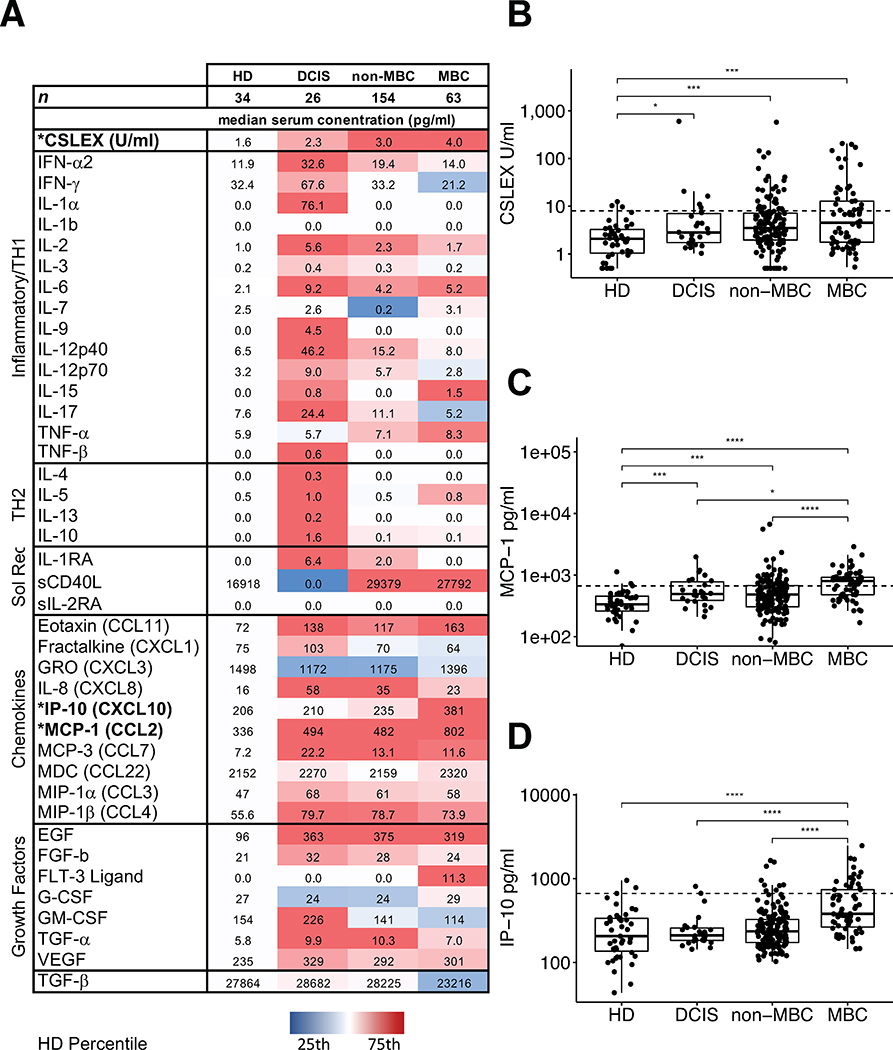
Fig 1. Levels of serum sLeX, IP-10, and MCP-1 in the study groups.
The heatmap (A) shows median values for each study group. Factors selected for survival analysis are in bold. The color code scale is set to the distribution of HD values for each target protein. Cytokines are loosely grouped into generally inflammatory and T-helper 1 (TH1) cellular immunity-related cytokines, TH2 humoral immunity-related cytokines, soluble cytokine receptors (Sol Rec), chemokines, and growth factors. (B) Compared to HD, median sLeX levels of DCIS (2.3 U/mL), non-MBC (2.9 U/mL), and MBC (4.0 U/mL) were significantly higher (all P < 0.05). MBC patients had a significantly higher levels of MCP-1 than DCIS (P = 0.019) or non-MBC (P < 0.0001, C); and higher levels of IP-10 than non-MBC, DCIS and HD (P < 0.0001, D). Dotted line shows cut-off for survival analysis.

