
Figure 2.
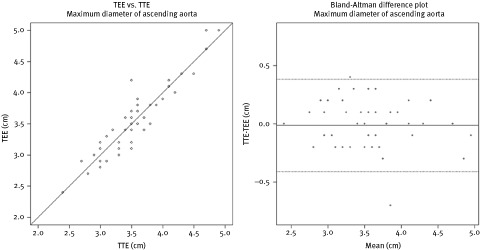
Scatterplot showing the correlation between transthoracic echocardiography (TTE) and transesophageal echocardiography (TEE) measurements for the maximal dimension of the ascending aorta. Bland‐Altman difference plots showing the mean differences between TTE and TEE measurements for the maximal dimension of the ascending aorta