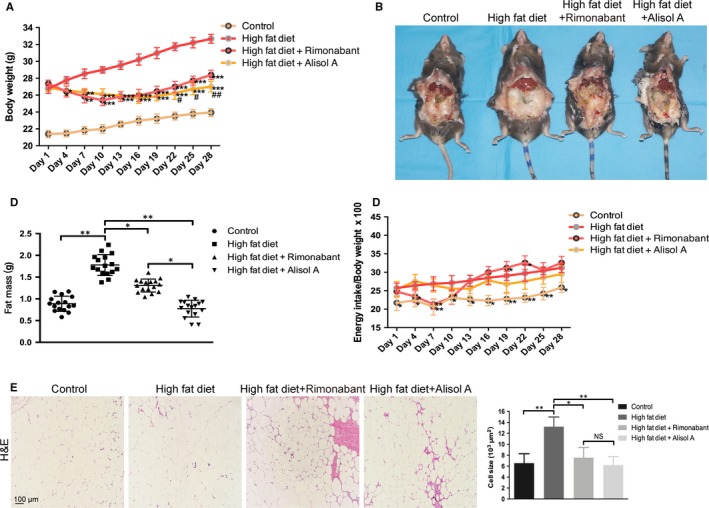
Figure 1.

Alisol A attenuates high‐fat‐diet‐induced obesity. A, Body weights of the four groups of mice, including the control group (normal diet), the HF group (high‐fat diet), the HFR group (high‐fat diet with rimonabant intervention) and the HFA group (high‐fat diet with alisol A intervention). B, Representative images of the abdominal cavity and fat pat. C, Weight of dissociated abdominal adipose tissue. D, Difference in the feed consumption of mice in each group during the experiment. E, H&E staining images of abdominal fat tissue and cell size quantification. Data are the mean ± SD. NS = not significant; *P < 0.05, **P < 0.01, ***P < 0.001 vs HF group, #P < 0.05, ##P < 0.01 vs HFR group
