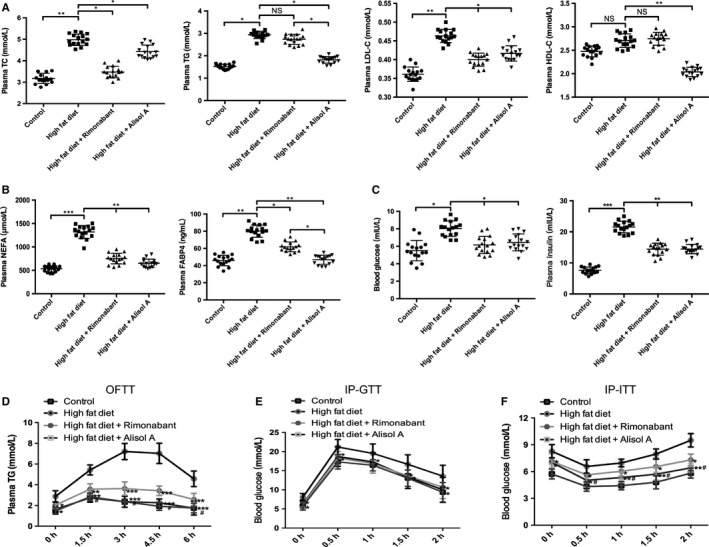
Figure 2.

Alisol A improves lipid and glucose metabolism in high‐fat‐diet‐induced obese mice. A, Plasma TG, TC, LDL‐C and HDL‐C in the four groups of mice. B, Plasma levels of NEFA and FABP4 in each group. C, Blood glucose and insulin levels in each group. Data are the mean ± SD. NS = not significant; *P < 0.05, **P < 0.01, ***P < 0.001. D, Plasma TG level during OFTT. Blood glucose concentration during the IP‐GTT (E) and IP‐ITT (F). Data are the mean ± SD. *P < 0.05, **P < 0.01, ***P < 0.001 vs HF group, #P < 0.05 vs HFR group
