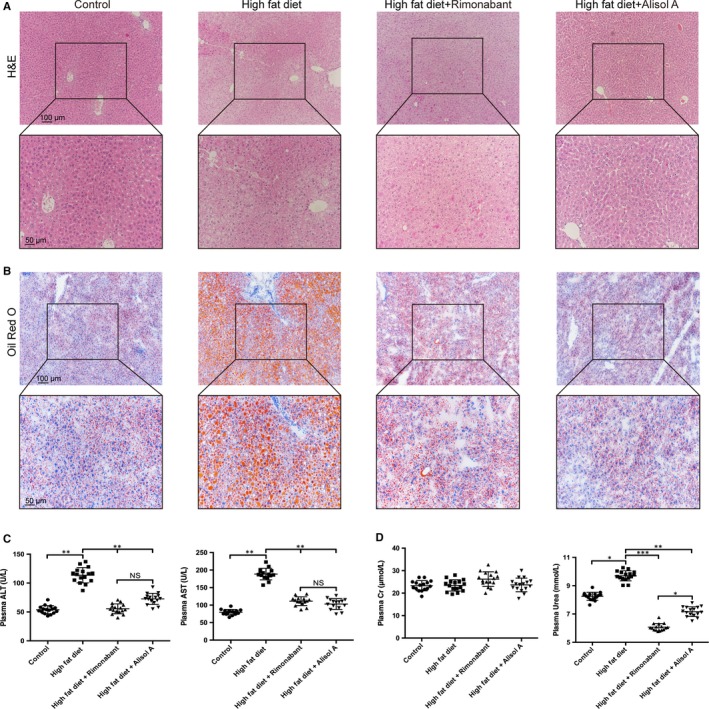
Figure 3.

Alisol A rescues high‐fat‐diet‐induced liver steatosis. Representative images of H&E (A) and Oil Red O (B) stained liver sections. Scale bars, 100 μm. Zoom scale bars: 50 μm. C, Plasma levels of ALT and AST in the four groups of mice. D, Plasma levels of creatinine and urea in the 4 groups of mice. Data are the mean ± SD. NS = not significant; *P < 0.05, **P < 0.01, ***P < 0.001
