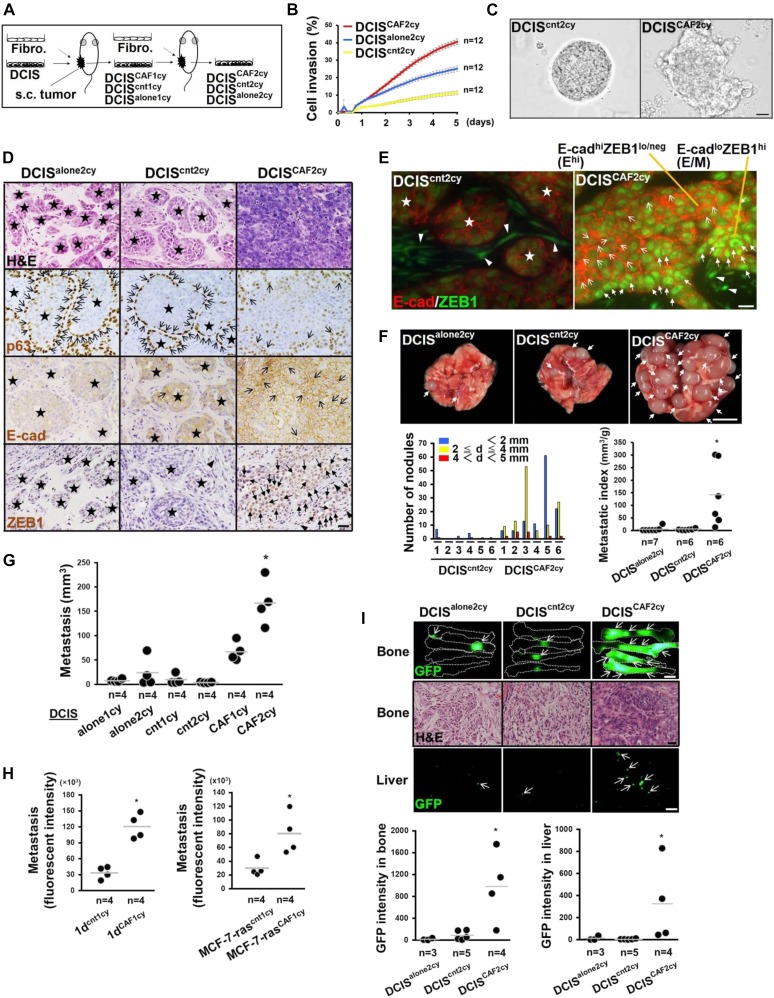
Figure 2. Highly invasive and metastatic breast cancer cells generated by intratumoral CAFs.
(A) Schematic representation of isolation of CAF-primed highly invasive and metastatic breast cancer cells. See text for details. (B) Scratch wound assay in the indicated cells. Error bars, SE. (C) Appearance of DCIScnt2cy and DCISCAF2cy organoids generated on Matrigel gel for 5 d. (D) H&E staining and immunostaining of sections prepared from 21-d-old subcutaneous tumors generated by the indicated cells using the described antibodies. p63+ or E-cadherin (E-cad)+ cancer cells (simple arrows), nuclear ZEB1+ cancer cells (triangular arrows), and nuclear ZEB1+ stromal cells (arrowheads) are also shown. (E) Immunofluorescence of 21-d-old tumor sections from DCISCAF2cy and DCIScnt2cy using anti–E-cad and anti-ZEB1 antibodies. The Ehi (simple arrow) and E/M (triangular arrow) tumor cells, and nuclear ZEB1+ stromal cells (arrowheads) are shown. (F) Representation of metastatic nodules (arrows) in whole lungs dissected from mice subcutaneously injected with the indicated cancer cells (upper). The size (d: diameter) and number of metastatic nodules are shown for the indicated groups (n = 6) (left). The lung metastatic indices were also evaluated in each group at 60 d after injection (right). (G) Lung metastasis volumes evaluated at 30 d after intravenous injection of the indicated cells into mice. (H) Metastases evaluated by tdTomato fluorescent intensity in the lungs at 30 d after intravenous injection of the indicated tdTomato+ tumor cells into mice. (I) Detection of GFP fluorescence (arrow) in bone (upper) and liver (lower) of mice at 60 d after intracardiac injection of the indicated GFP+ cancer cells. H&E staining of bone metastasis (middle) is also shown for the described groups. Quantification of GFP intensity of the indicated cells colonizing bone and liver (graphs). Data information: Star indicates intact acinar structure of DCIS cells (D, E). Asterisk indicates a significant difference relative to others (F–I). Mann–Whitney U test (F, H, I) and Wilcoxon rank sum test (G). The horizontal line represents the mean value (F–I). Scale bars, 10 μm (E), 30 μm (C, D and I-H&E), 3 mm (I-GFP image), and 5 mm (F). See also Fig S2.
Source data are available for this figure.

