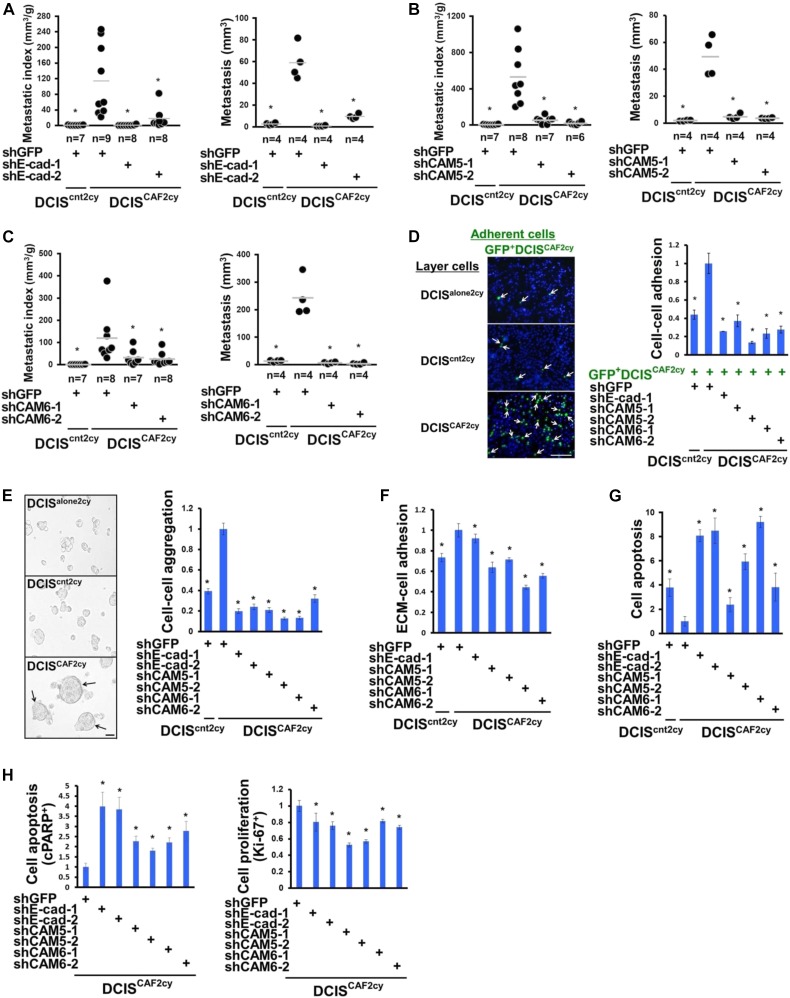
Figure 4. The Ehi state required for invasive and metastatic abilities in DCISCAF2cy.
(A–C) Lung metastatic indices (left) evaluated at 60 d after subcutaneous injection of the indicated cells into mice. Lung metastatic volume (right) was evaluated at 30 d after intravenous injection of the indicated cells into mice. (D) Appearance of GFP+DCISCAF2cy (arrows) attached to the top layer of the indicated cells (left). The relative numbers of GFP+DCISCAF2cy attached to the indicated cells (n = 4) are shown (right). (E) Appearance of larger cell aggregates (arrows) formed by DCISCAF2cy compared to DCISalone2cy and DCIScnt2cy on low attachment culture dishes (left). The relative volume of cell aggregates is shown in the indicated cells (n = 5) (right). (F) The ECM (collagen)–cell adhesion measured in the indicated cells (n = 4–9). (G) Cell apoptosis measured in the indicated cells (n = 5) on low attachment culture dishes. (H) The relative apoptotic (left) and proliferating (right) tumor cell proportions in experimental lung metastases generated by DCISCAF2cy expressing the indicated shRNA (n = 4) by immunostaining using anti-cPARP and anti–Ki-67 antibodies, respectively. Data information: Asterisk indicates a significant difference relative to GFP-shRNA–expressing DCISCAF2cy (A–H). t test (D–H) and Mann–Whitney U test (A–C). Error bars, SE. The horizontal line represents the mean value (A–C). Scale bars, 30 μm (E) and 300 μm (D). See also Fig S4.

