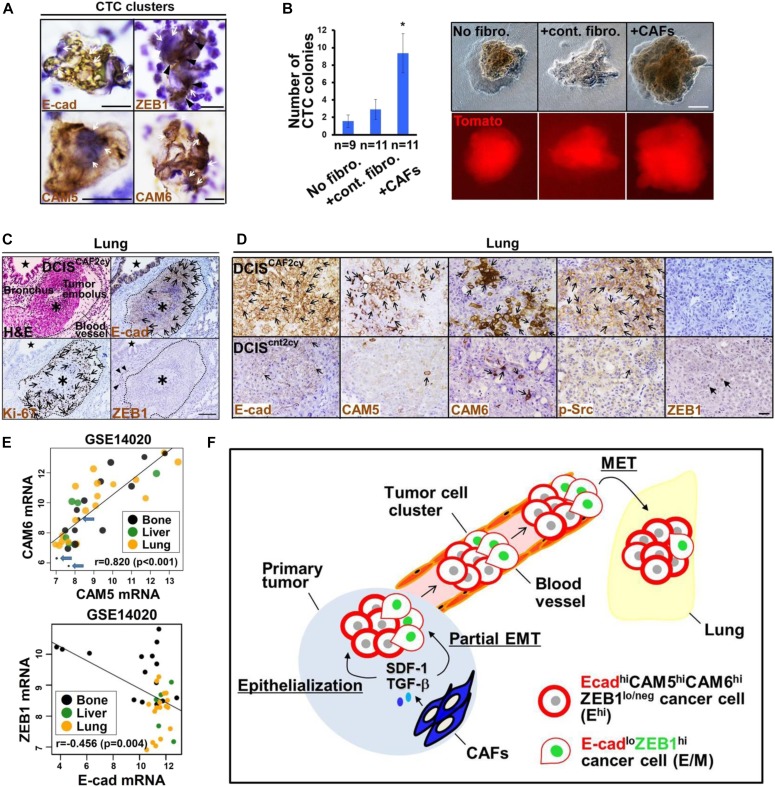
Figure 8. CAF-induced CTC clusters, tumor emboli, and metastatic colonization.
(A) Immunostaining of cytospin-concentrated smears prepared from peripheral blood of mice bearing 30-d-old DCIS tumors admixed with CAFs using the indicated antibodies. Positive staining (brown) for E-cad, CAM5, CAM6, and ZEB1 and hematoxylin nuclear staining (blue) indicated by arrows are shown in cancer cells of CTC clusters. Nuclear ZEB1 staining (arrowhead) is also depicted in tumor cells. A number of leukocytes around the CTC clusters are stained with hematoxylin. (B) Number of CTC colonies evaluated by colony-forming assay (left). Peripheral blood was collected from mice injected subcutaneously with tdTomato-labelled, blasticidin-resistant DCIS cells admixed with no fibroblasts (No fibro.), control fibroblasts (+cont. fibro.), or CAFs (+CAFs) before culture in the presence of blasticidin on a petri dish for 21 d. Visualization of blasticidin-resistant CTC colonies (right-upper) and their tdTomato positivity under fluorescent microscopy (right-lower). Asterisk indicates a significant difference relative to No fibro. and +cont. fibro. groups. Error bars, SE. (C) H&E staining and immunohistochemistry of lung sections prepared at 60 d after subcutaneous injection of DCISCAF2cy into mice using the indicated antibodies. E-cad+ and Ki-67+ carcinoma cells (arrows) are indicated in tumor emboli (asterisk in broken circle). E-cad+ epithelial cells are also shown in a bronchus (star), as well as nuclear ZEB1+ mesenchymal cells (arrowheads). (D) Immunostaining of lung sections prepared at 60 d after subcutaneous injection of DCISCAF2cy or DCIScnt2cy into mice using the indicated antibodies. E-cad+, CAM5+, CAM6+, and p-Src+ cancer cells (simple arrows) as well as nuclear ZEB1+ cancer cells (triangular arrows) are shown. (E) Linear correlations between the indicated genes expressed in metastatic sites, including the bone, liver, and lung in the breast cancer patient cohort GSE14020. E-cad expression is represented by the sizes of circles including the three patients with the lowest E-cad expressions indicated by arrows (upper). (F) Schematic representation of CAF-induced invasive and metastatic tumor cell clusters composed of Ehi and E/M tumor cells during the invasion-metastasis cascade. See text for details. Data information: Wilcoxon rank sum test (B) and two-sample correlation test (E). Scale bars, 10 μm (A), 1 mm (B), 100 μm (C), and 30 μm (D). See also Fig S7.

