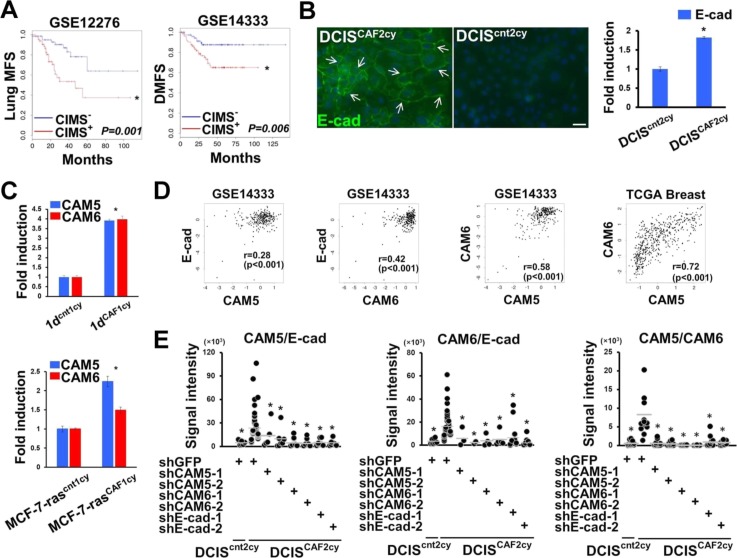
Figure S3. Related to Fig 3. The Ehi state mediated by E-cad, CAM5, and CAM6 expression in DCISCAF2cy.
(A) Kaplan–Meier survival analysis for lung metastasis-free survival (MFS) and distant metastasis-free survival (DMFS) using the CAF-induced metastasis signature (CIMS) in the indicated human breast cancer patient cohorts. (B) Immunofluorescence (left) and real-time PCR (right) of the indicated cells measuring E-cad expression. E-cad+ cancer cells (arrows) are shown. Scale bar, 30 μm. (C) Real-time PCR of the indicated cells using primers specific for CAM5 and CAM6. (D) Positive linear correlations between E-cad, CAM5, and CAM6 mRNA expressions in the GSE14333 cohort and the human TCGA breast cancer cohort. (E) Signal intensity differences between CAM5/E-cad, CAM6/E-cad, and CAM5/CAM6 on the indicated cells expressing various shRNAs evaluated by in situ PLA. The horizontal line represents the mean value. Data information: Asterisk indicates a significant difference relative to the CIMS− group (A), DCIScnt2cy (B), the control group (C), and GFP-shRNA–expressing DICSCAF2cy (E). t test (B, C), Mann–Whitney U test (E) and Cox proportional hazards regression test (A). Error bars, SE.

