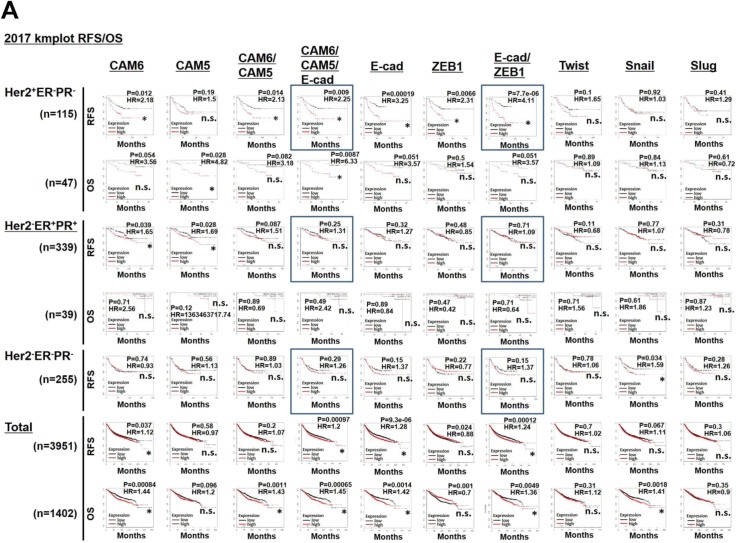
Figure S8. Related to Fig 9. The Ehi and E/M states in DCISCAF2cy are associated with poor outcomes in Her2⁺ER−PR− breast cancer patients.
(A) Kaplan–Meier survival analysis for high (red line) and low (black line) expression levels of the indicated genes in the described breast cancer patients. The rectangle indicates data shown in Fig 9D. The hazard ratio (HR) is also shown. n.s., not significant. Asterisk indicates a significant difference relative to the group with lower expression using the Cox proportional hazards regression test. OS, overall survival; RFS, relapse-free survival.

