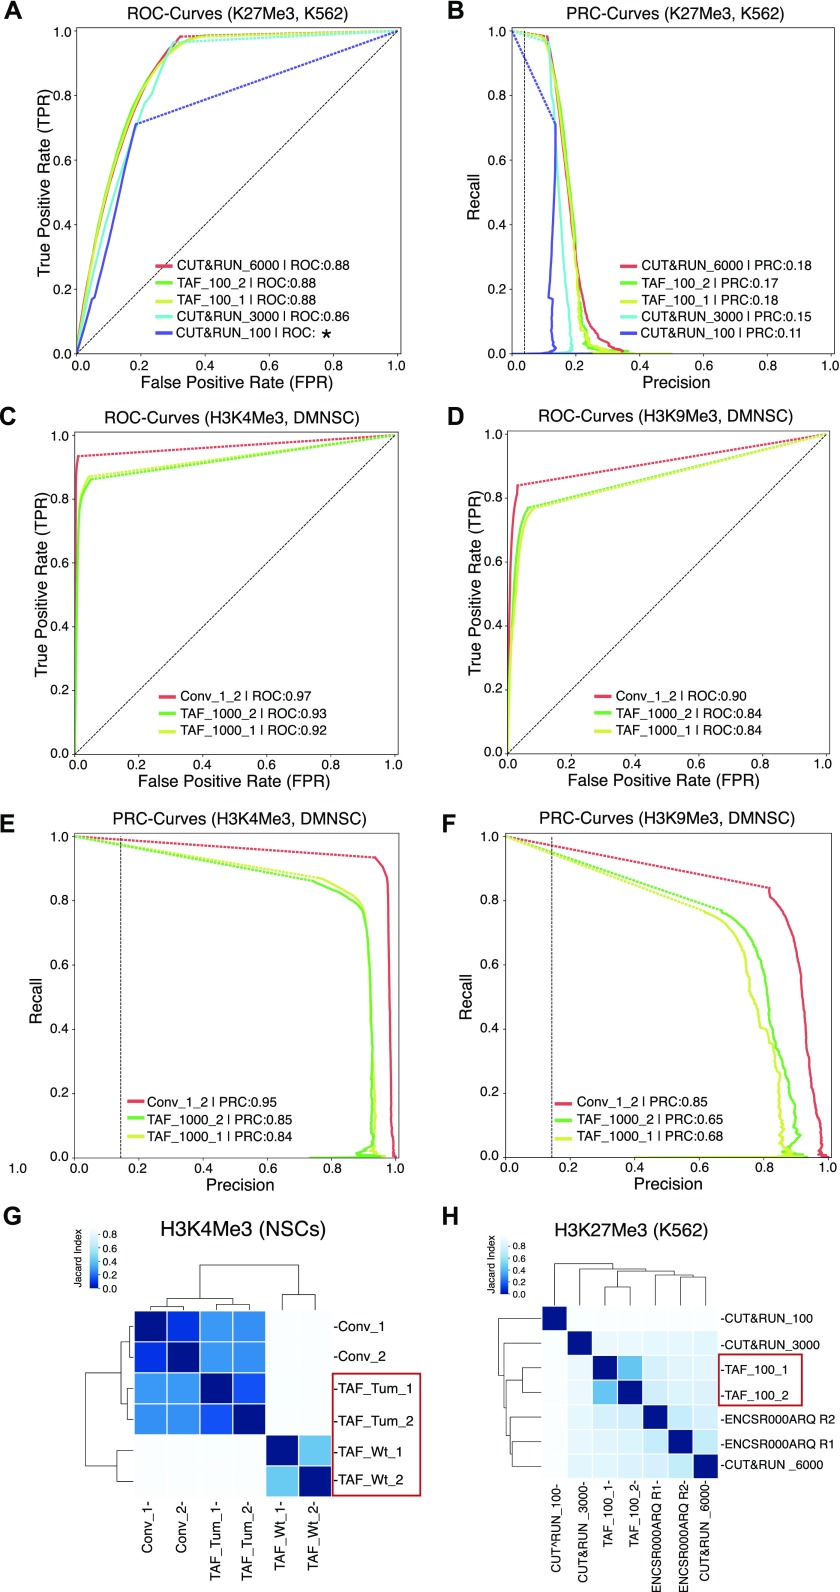
Figure 2. Comparison of TAF-ChIP with conventional ChIP-Seq and with the CUT&RUN low amount method.
(A) ROC curves of TAF-ChIP and CUT&RUN for H3K27Me3 in K562 cells. The ROC curves were plotted using as reference replicated peaks of the conventional ChIP-Seq ENCODE dataset selected at 5% FDR cutoff (downloaded from the ENCODE database). No FDR cutoff was used to define peaks for TAF-ChIP replicates and the CUT&RUN datasets with MACS2. Peaks were mapped to 5 kb non-overlapping genomic windows to calculate true-positive rate or recall, false-positive rate and precision for a changing P-Value threshold. Area under the curve (AUC) is indicated in the legend in decreasing order, and the * indicates the failure to faithfully calculate the AUC. (B) Precision-recall curve for TAF-ChIP and CUT&RUN datasets for H3K27Me3 in K562 cells. (C, D) ROC curves of TAF-ChIP and conventional ChIP-Seq in Drosophila NSCs. The ROC curves for H3K4Me3 (C) and H3K9me3 (D) were plotted using as reference peaks of the first conventional ChIP-Seq replicate selected at 5% FDR cutoff. No FDR cutoff was used to define peaks for TAF-ChIP replicates and the second conventional ChIP-Seq replicate. Peaks were mapped to 1 kb non-overlapping genomic windows to calculate true-positive rate or recall, false-positive rate, and precision. AUC is indicated in the legend in decreasing order. (E, F) Precision-recall curve for TAF-ChIP and conventional ChIP-Seq in Drosophila NSCs. Using same references and data as above, precision-recall curves were plotted for H3K4Me3 (E) and H3k9Me3 (F). (G) Comparison of the genomic window sets for Drosophila brain-derived wt NSCs analyzed for H3K4Me3 binding by TAF-ChIP (TAF_Wt), and Drosophila tumor-derived NSCs analyzed by TAF-ChIP or conventional ChIP-Seq (TAF_Tum and Conv). The TAF-ChIP samples are highlighted by a red rectangular box. The heat map indicates pairwise similarity according to the Jaccard index. Axes show results of hierarchical clustering. (H) The Jaccard index and hierarchical clustering, as described in (G), to compare H3K27Me3 binding in K562 cells. The comparison was performed for 100 cells TAF-ChIP samples (highlighted with a red rectangular box), to CUT&RUN method with 100, 3,000, and 6,000-cell samples, and to conventional ChIP-Seq (ENCODE) (12, 19).

