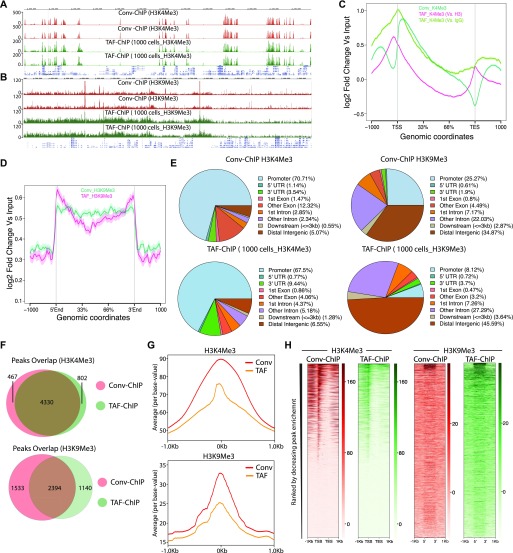
Figure 4. TAF-ChIP results from low number of NSCs are comparable with conventional ChIP-Seq (Conv-ChIP).
(A, B) Genome browser track example of H3K4Me3 and H3K9Me3 ChIP (panel A and B, respectively) performed in FACS-sorted NSCs with conventional ChIP-Seq (1.2 million cells) and TAF-ChIP (1,000 cells), as indicated by the labels. The label below the tracks shows the gene model and the y-axis represents normalized read density in reads per million (rpm). (C) Metagene profiles of H3K4Me3 with standard error to the mean for all genes, −1,000 bp upstream of TSS and +1,000 bp downstream of transcription end sites (TESs). Log2-fold changes against input controls are shown on the y-axis, whereas the x-axis depicts genomic coordinates. (D) Metagene profiles of H3K9Me3 with standard error to the mean for enriched regions, −1,000 bp upstream and +1,000 bp downstream of peaks. Log2-fold changes against input control are shown on the y-axis, whereas the x-axis depicts genomic coordinates. (E) Distribution of annotated peaks obtained from conventional ChIP-Seq and TAF-ChIP, for indicated histone marks. Note that most H3K4Me3 and H3K9Me3 peaks are at the promoters and at the intergenic regions, respectively, consistent with the expectation. (F) Overlap between the peaks identified from conventional ChIP-Seq and TAF-ChIP datasets, for the indicated histone modifications. MACS2 software with identical parameters (see the Materials and Methods section for details) was used to identify the peaks against the respective input controls, and those present in both replicates were considered for the comparison. (G) Average profile of TAF-ChIP and conventional ChIP-Seq centered at the peaks for the indicated histone modifications. The y-axis depicts average per base value into the peaks, whereas the x-axis depicts genomic coordinates centered at the peaks. (H) Distributions of reads at gene locations of indicated histone modifications from conventional ChIP-Seq and TAF-ChIP. Rows indicate all the peaks and are sorted by decreasing affinities in the conventional ChIP-Seq datasets. The color labels to the right indicate the level of enrichment.

