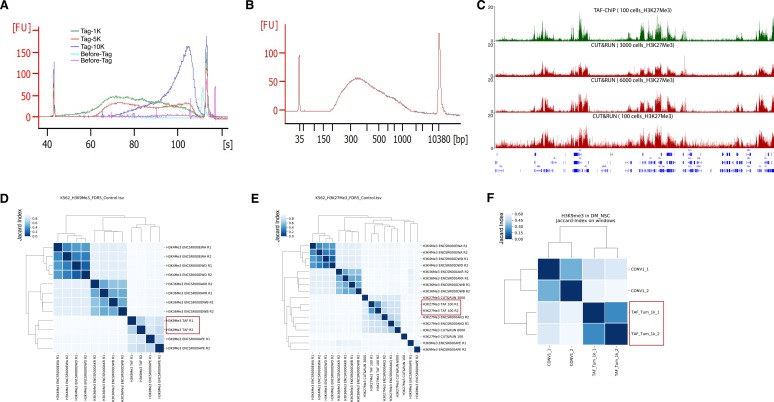
Figure S1. Comparison of TAF-ChIP with ENCODE, conventional ChIP-Seq, and CUT&RUN.
(A) Bioanalyzer profile before and after tagmentation with indicated cell numbers. The amount of Tn5 tagmentase was kept constant in all conditions. (B) Bioanalyzer profile of a representative TAF-ChIP library showing the size distribution of final library fragments. (C) Genome browser track example of H3K27Me3 with TAF-ChIP approach and recently published CUT&RUN method with different cell numbers, as indicated in the labels. The label below the tracks shows the gene model, and the y-axis represents normalized read density in reads per million. (D) Clusterogram of TAF-ChIP H3K9Me3 (highlighted with a rectangular box) and indicated datasets derived from the signal in the peak file. H3K4Me3 and H3K36Me3 were included as controls. Note that the TAF-ChIP replicates for H3K9Me3 cluster together with the equivalent datasets from ENCODE. The legend in the left indicates the distance based on Jaccard index. (E) Clusterogram of TAF-ChIP H3K27Me3 datasets (highlighted by a rectangular box) with equivalent datasets from ENCODE, CUT&RUN datasets (from 100, 3,000, and 6,000 cells), and nonrelated histone modification datasets used as control. (F) Clusterogram of TAF-ChIP H3K9Me3 datasets (highlighted by a rectangular box) with conventional ChIP-Seq dataset from Drosophila NSCs.

