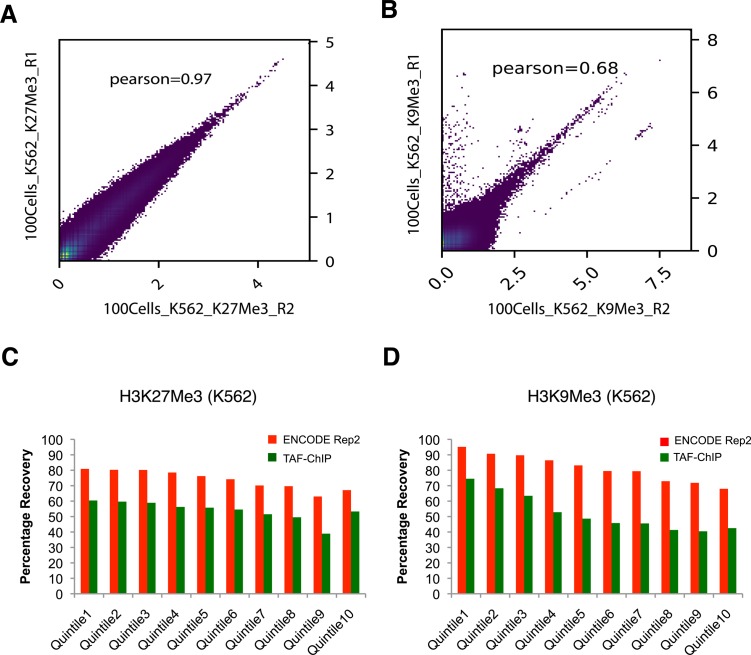
Figure S2. TAF-ChIP libraries evaluated in terms of replicate variability and peaks recovery, from 100 K562 cells.
(A, B) Pearson correlation between the indicated replicates of TAF-ChIP samples from 100 K562 cells, across equal sized bins of 2000 bp. (C, D) Percentage recovery of peaks in TAF-ChIP dataset compared with a corresponding ENCODE ChIP-Seq dataset. The quantiles were sorted according to increasing FDR (provided by MACS2). Recovery of peaks of one of the replicates of the ENCODE ChIP-Seq dataset when the other is used as reference is shown for comparison. For H3K27Me3 (C) and H3K9Me3 (D), histone modifications in K562 cells.

