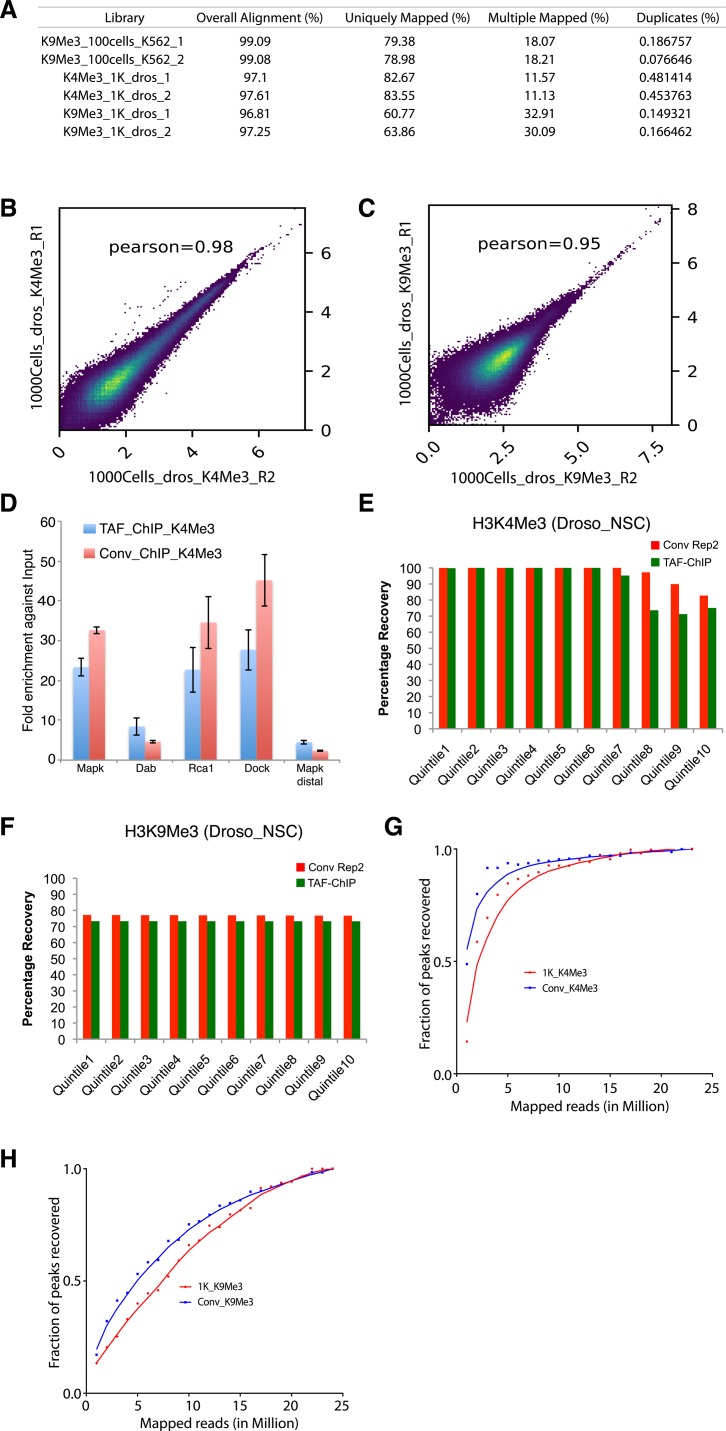
Figure S3. TAF-ChIP libraries evaluated in terms of replicate variability and peaks recovery, from 1,000 Drosophila NSCs.
(A) Table showing the percentage of mapped reads from TAF-ChIP experiments. The read duplicates were quantified using Picard Tools. (B, C) Pearson correlation between the indicated replicates of TAF-ChIP samples from Drosophila 1,000 cells, across equal-sized bins of 500 bp. (D) ChIP-qPCR analysis of enrichment at the tested loci in TAF-ChIP and conventional approach against respective input controls, fragmented DNA in conventional and H3 for TAF. The tested loci Mapk, Dab, Rca1, and Dock showed enrichment in conventional and TAF-ChIP-Seq results, whereas Mapk distal did not show any enrichment in either approach. (E, F) Percentage recovery of peaks in TAF-ChIP datasets compared with conventional ChIP-Seq datasets. The quantiles were sorted according to increasing FDR (provided by MACS2). Recovery of peaks of one of the replicates of conventional ChIP-Seq using the other as reference is shown for comparison. For H3K4Me3 (E) and H3K9Me3 (F), histone modifications in Drosophila NSCs. (G, H) Fraction of peaks recovered for H3K4Me3 (G) and H3K9Me3 (H) TAF-ChIP samples from Drosophila, at various sequencing depths.

