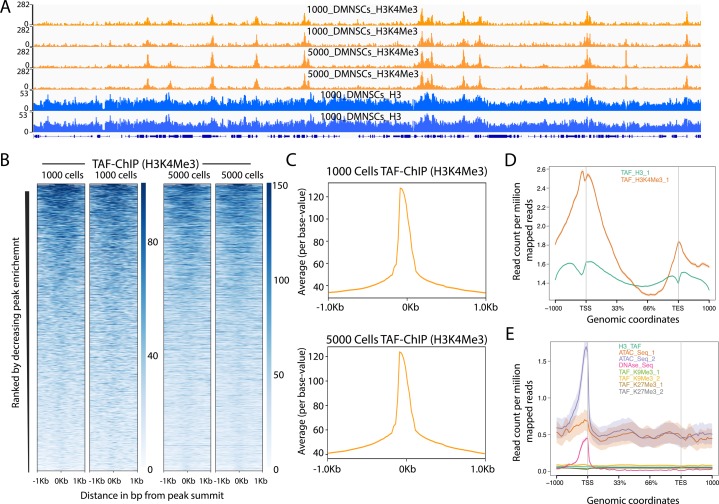
Figure S4. TAF-ChIP results from different amounts of starting material are identical and H3 TAF-ChIP do not show any visible biases for open chromatin.
(A) Genome browser track example of H3K4Me3 ChIP performed for two replicates in 1,000 and 5,000 FACS-sorted Drosophila NSCs along with H3 controls, as indicated in the labels. The label below the tracks shows the gene model, and the y-axis represents normalized read density in reads per million (rpm). (B) Heat maps of TAF-ChIP datasets for H3K4Me3 from 1,000 and 5,000 sorted Drosophila NSCs. Rows indicate all the peaks and are sorted by decreasing affinities in the conventional ChIP-Seq datasets. The color labels to the right indicate the level of enrichment. (C) Average profile of TAF-ChIP data from 1,000 and 5,000 NSCs, centered at the peaks for the H3K4Me3 modification. The y-axis depicts average per base peak signal, whereas the x-axis depicts genomic coordinates centered at the peaks. (D) Metagene profiles of H3 and H3K4Me3 from 1,000 Drosophila NSCs with standard error to the mean for all genes, −1,000 bp upstream of transcription start sites and +1,000 bp downstream of transcription end sites (TESs). Read counts per million of mapped reads is shown on the y-axis, whereas the x-axis depicts genomic coordinates. (E) Metagene profiles of indicated datasets with standard error to the mean for all genes in K562 cells, −1,000 bp upstream of TSSs and +1,000 bp downstream of TESs. Read counts per million of mapped reads is shown on the y-axis, whereas the x-axis depicts genomic coordinates. The ATAC-Seq and DNAse-Seq datasets are derived from PMID: 26280331.

