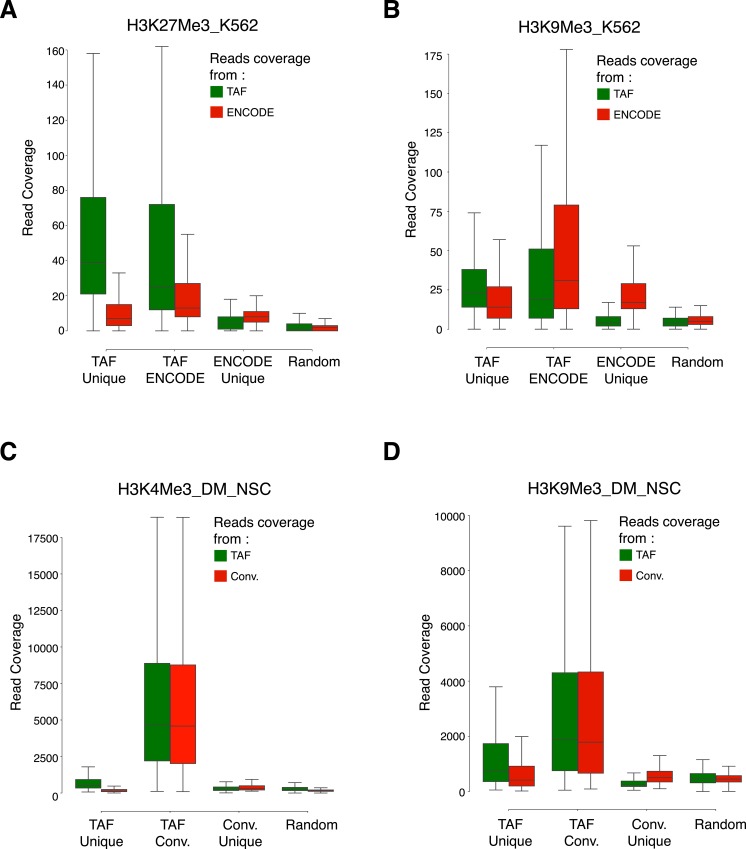
Figure S5. Coverage of reads over the overlapping and unique peaks identified in the TAF-ChIP and conventional datasets.
(A–D) Boxplots showing coverage of raw reads over the peaks identified either uniquely in TAF (TAF Unique) or conventional ChIP-Seq approach (ENCODE Unique or Conv. Unique), or common to both of the approaches (TAF ENCODE or TAF Conv.). Shown also is the coverage of reads over randomly selected regions of comparable size (Random). From K562 cells for H3K27Me3 (A) and H3K9Me3 (B), and from Drosophila NSCs for H3K4Me3 (C) and H3K9Me3 (D).

