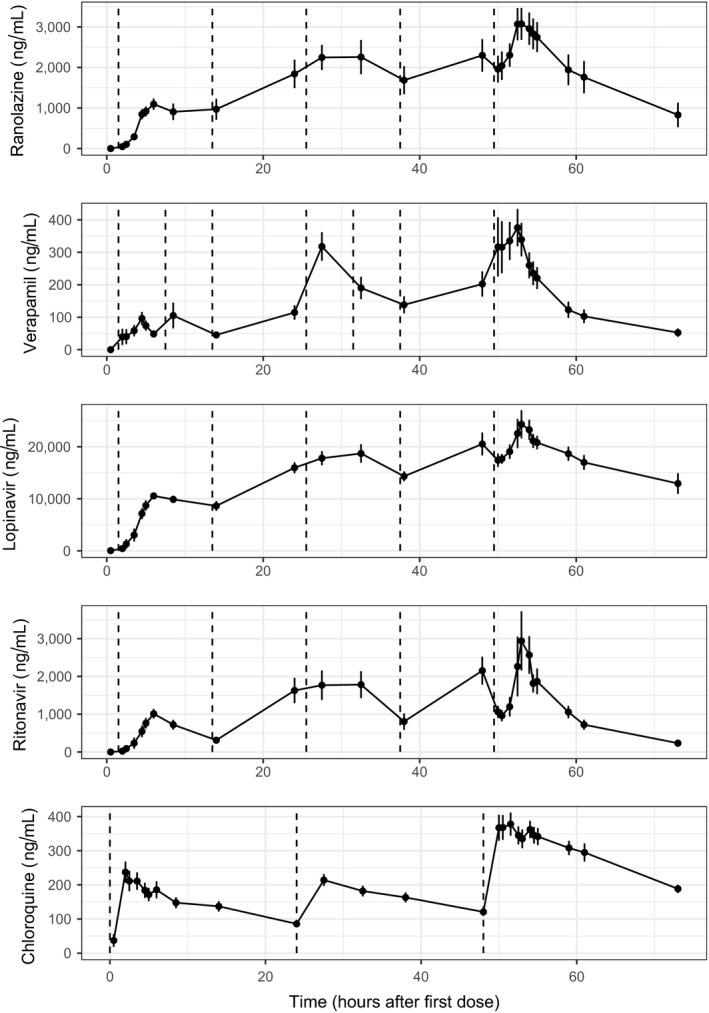
Figure 1.

Part 1 pharmacokinetic (PK) time profiles. Mean (dots) and standard error (error bars) of PK plasma concentration profiles for ranolazine, verapamil, lopinavir, ritonavir, and chloroquine per timepoint after first dose on day 1. Dashed vertical lines show the time of active treatment doses for ranolazine (1,500 mg after breakfast and in the evening), verapamil (120 mg immediate release after breakfast and in the afternoon, 240 mg extended release in the evening), lopinavir/ritonavir (lopinavir 800 mg/ritonavir 200 mg after breakfast and in the evening), and chloroquine (1,000 mg day 1, 500 mg day 2, and 1,000 mg day 3, all before breakfast). Oral placebo was administered at dosing timepoints that had no active treatment dosing as well as throughout all the dosing timepoints in the placebo treatment arm (not shown).
