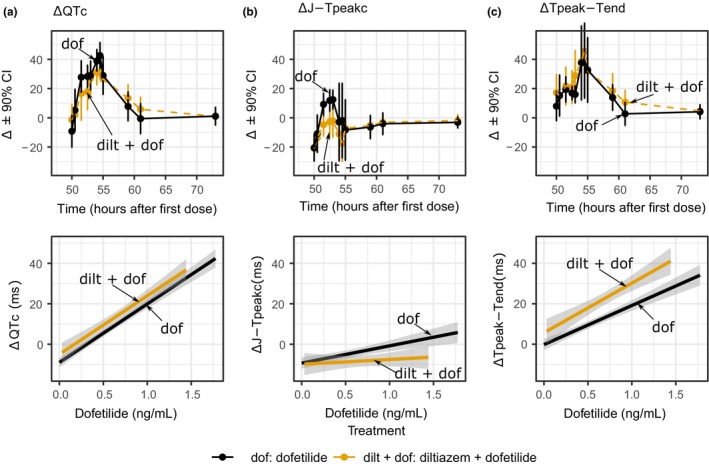
Figure 5.

Part 2 pharmacodynamic time‐profiles and concentration‐response linearity plots. Top row panels show drug‐induced changes (mean ± 90% confidence interval (CI)) for the change from baseline (Δ) of (a) heart rate corrected QT (QTc), (b) heart rate corrected J‐Tpeak (J‐Tpeakc), and (c) Tpeak‐Tend on day 3 of dofetilide alone (black) and diltiazem + dofetilide (orange) treatments. The y‐axis range of each panel has been adjusted to enhanced interpretation. Bottom row panels show exploratory plots with linear regression fit through all the data for dofetilide alone (black) and diltiazem + dofetilide (orange) for drug‐induced Δ in (a) QTc, (b) J‐Tpeakc, and (c) Tpeak‐Tend. Note that there is no change in ΔQTc prolongation associated with dofetilide (hERG block) when diltiazem (calcium block) is co‐administered. See Supplementary Material S1 for full time profiles as well as concentration‐response plots of dofetilide (hERG block) vs. dofetilide + diltiazem (hERG + calcium) vs. dofetilide + mexiletine (hERG + late sodium).
