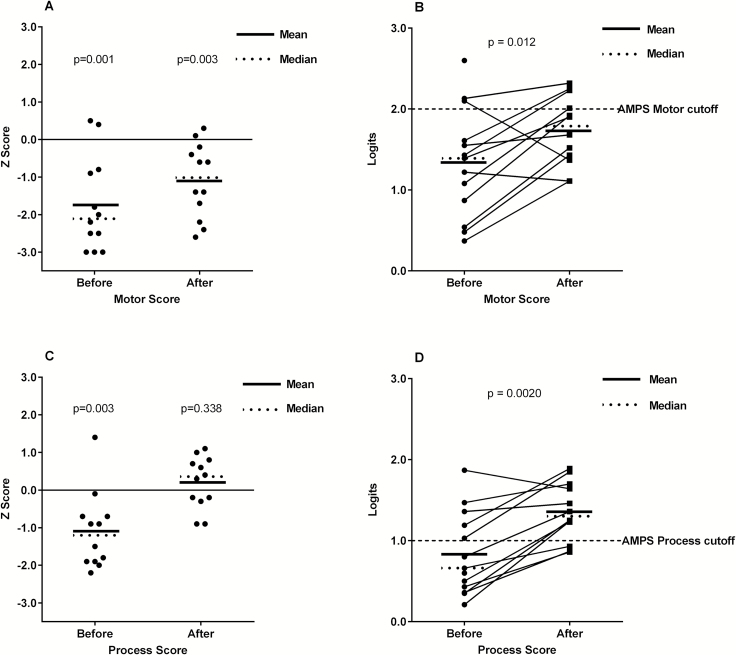
Fig. 2.
A) Z scores for AMPS motor score, before and after the intervention. Participants had significantly lower values compared to the norm before the intervention, and although the score improved after the intervention, it was still significantly lower than the norm (1-sample t test). B) AMPS motor skill scores in logits before and after the intervention increased significantly in the within-subjects analysis. The cut-off level for independent living (indicated in figure) is regarded to be 2.0 for AMPS motor skills. C) Z scores for AMPS process score before and after the intervention. Participants had significantly lower process scores compared to the norm before the intervention but after the intervention the score was within the normal range (1-sample t test). D) AMPS process skill scores in logits before and after the intervention also increased significantly in the within-subjects analysis. The cut-off level for independent living (indicated in figure) is regarded to be 1.0 for AMPS process skills.

