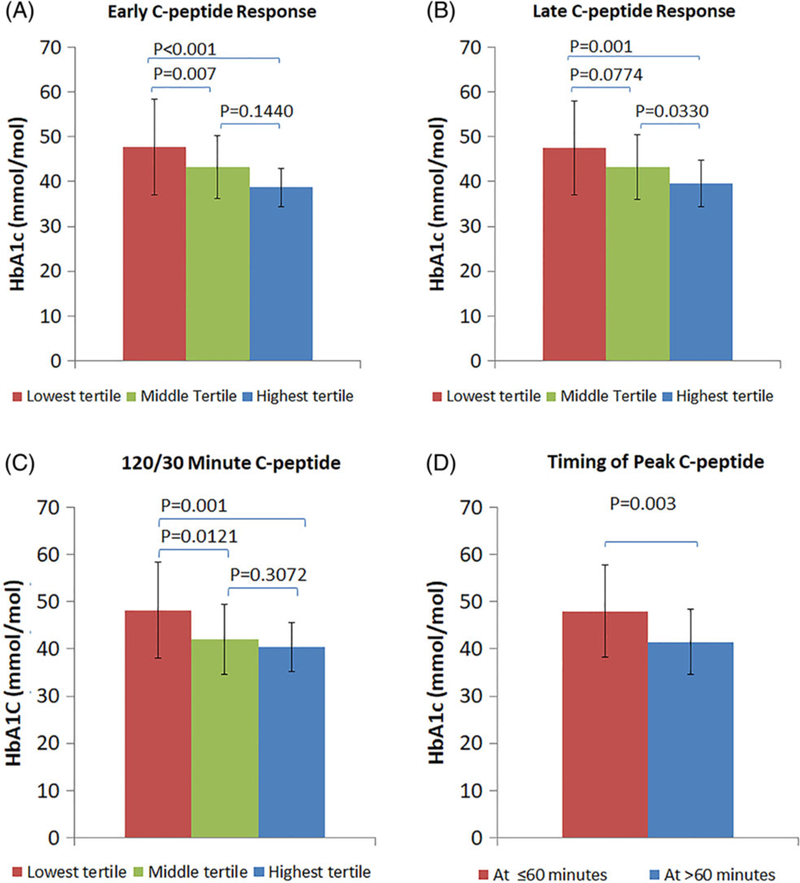
FIGURE 1.

(A) Comparison of HbA1c values (mean ± SD) among the lowest, middle and highest tertiles of the early C-peptide response. (B) Comparison of HbA1c values (mean ± SD) among the lowest, middle and highest tertiles of the late C-peptide response. (C) Comparison of HbA1c values (mean ± SD) among the lowest, middle and highest tertiles of the 120/30 minutes C-peptide. (D) Comparison of HbA1c values (mean ± SD) between the peak C-peptide occurring at ≤60 minutes and the peak C-peptide occurring at >60 minutes
