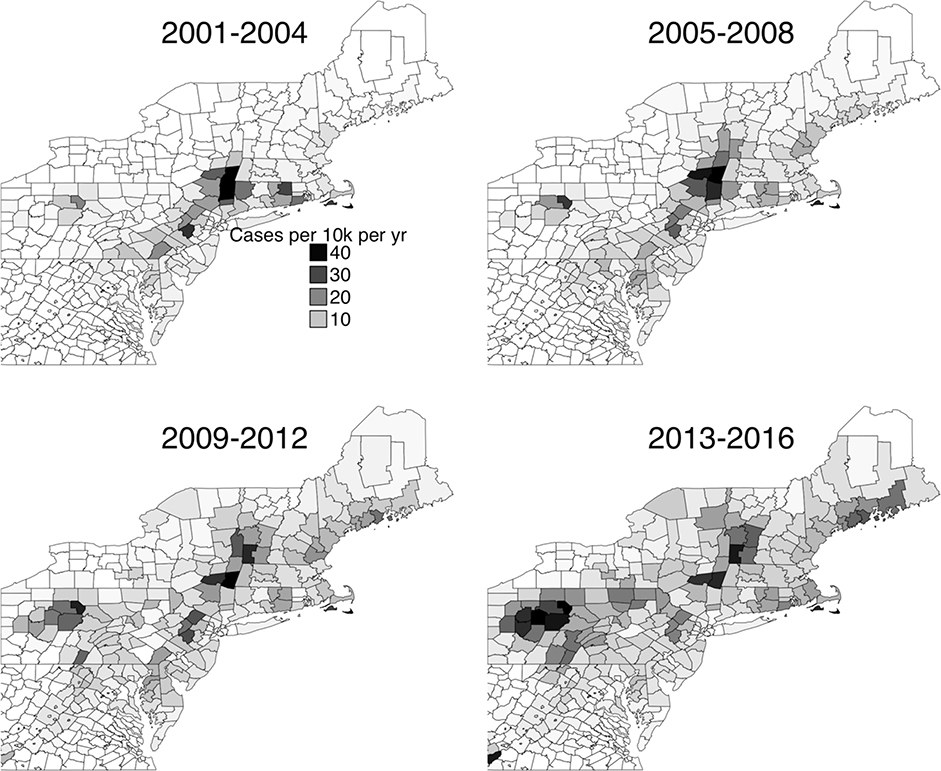
Figure 1:
County level incidence map of Lyme diseases cases reported to the CDC. Each subgraph gives the average annual number of cases per 10,0000 people over the four-year period. Lyme disease case numbers from the CDC (2018). Annual county population estimates from the US Census Bureau (2018a, 2018b).

