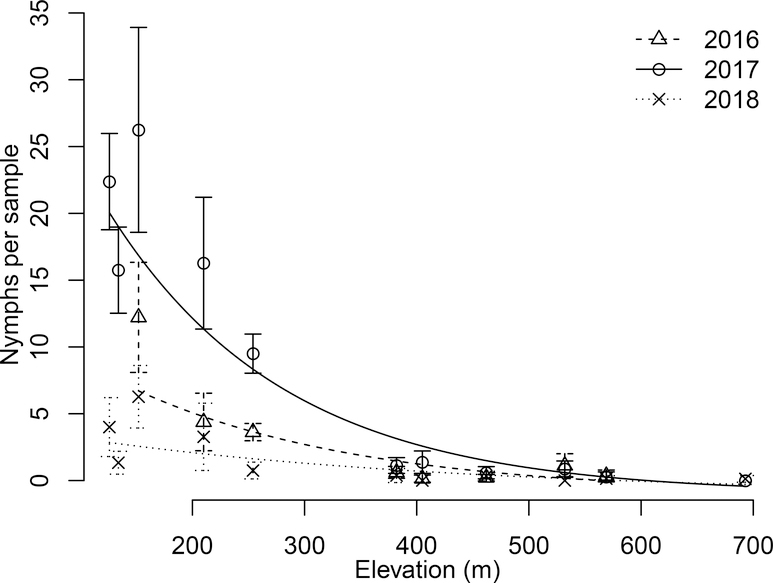
Figure 4:
Density of questing nymphal ticks per 200 m2 drag sample between May 15 and July 15 as a function of site elevation. The error bars indicate the standard error around each mean. For each year we performed a simple linear regression between log tick density plus one and elevation. We took the inverse of the transformation to plot untransformed tick density, so these lines became negative exponential curves. Each linear relationship was significant: 2016 F1,6 = 16.4, p = 0.007; 2017 F1,8 = 92.0, p = 0.000005; and 2018 F1,9 = 17.9 p = 0.002.

