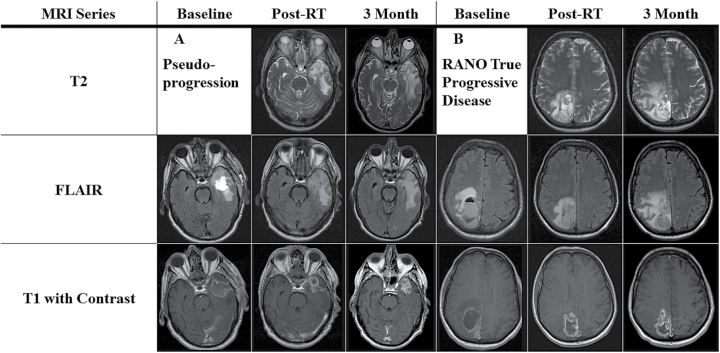
Fig. 1.
T2, FLAIR, and gadolinium-enhanced images at baseline—immediately prior to CRT; post-treatment—at the completion of CRT; and at the second post-treatment scan. (A) Pseudoprogression example. The rim of the surgical cavity demonstrates progressive thickening on T1 with increased FLAIR and T2 signal. Subsequent stabilization at the second post-treatment scan was observed. (B) True progression example. T1 imaging demonstrates minimal change in nodularity of surgical cavity post-CRT. Progressive changes on T2 and FLAIR are consistent with progression as per RANO.

