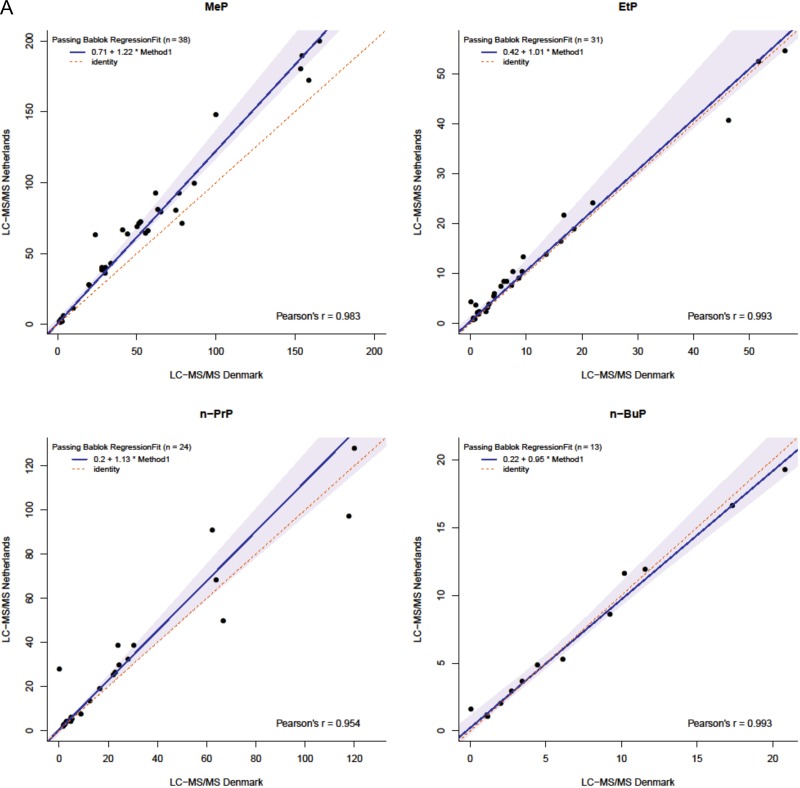
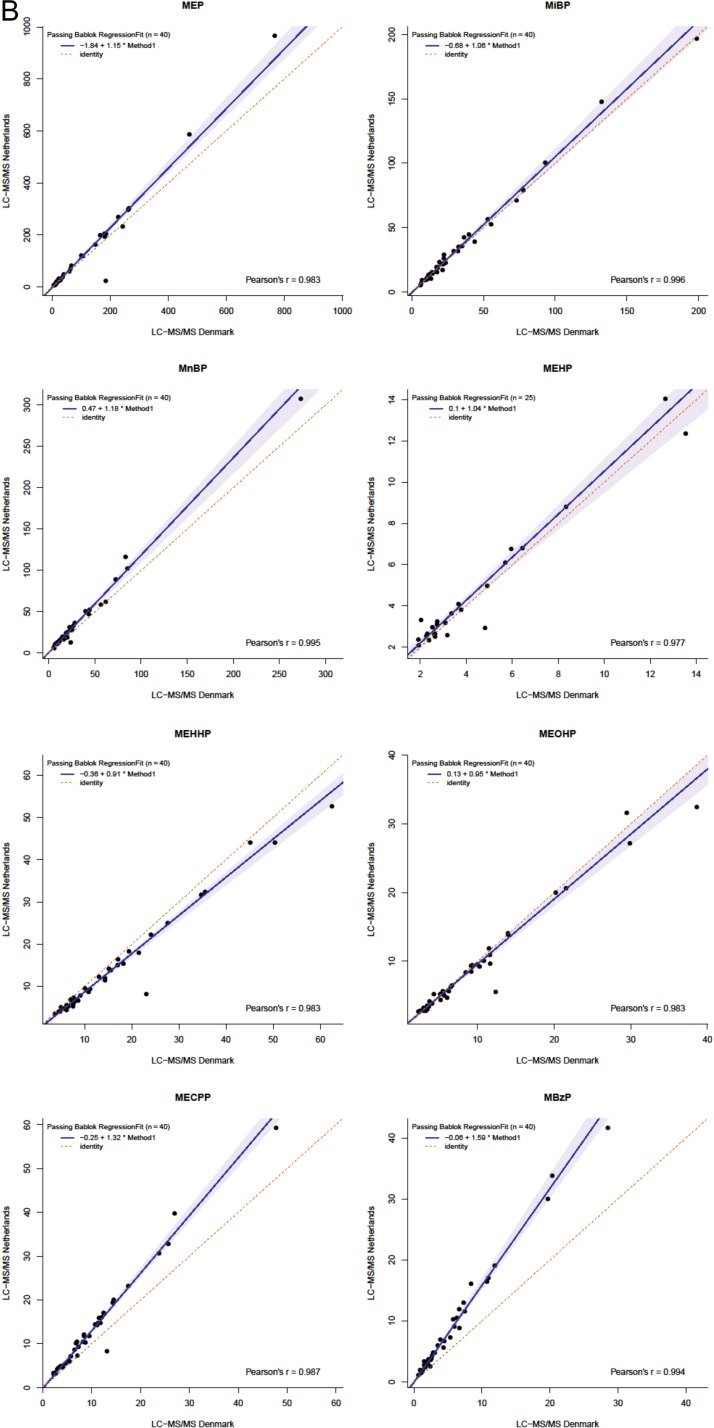
Figure 2.
Passing Bablok regression plots comparing parabens (A) and phthalate metabolites (B) in 40 human urine samples measured by the present method (y-axis) and by LC–MS-MS methods at Department of Growth and Reproduction, Rigshospitalet, Copenhagen (x-axis). The line of identity (x = y) represents a perfect match.


