
Fig. 6.
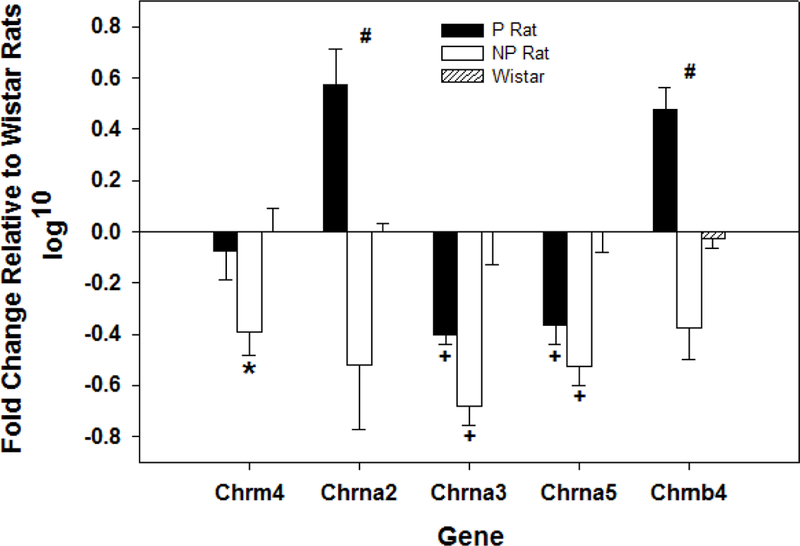
Displays the mean (+ SEMs) of the log10 transformation of the RT-PCR detection of acetylcholine related genes that were significantly different in P, NP, and Wistar (controls) rat lines in the posterior VTA using the TMLDA platform (n = 8/line). * indicates significantly different from all other groups. # indicates that all groups are statistically different from each other. + indicates that both the P and NP rats are statistically different from Wistar.