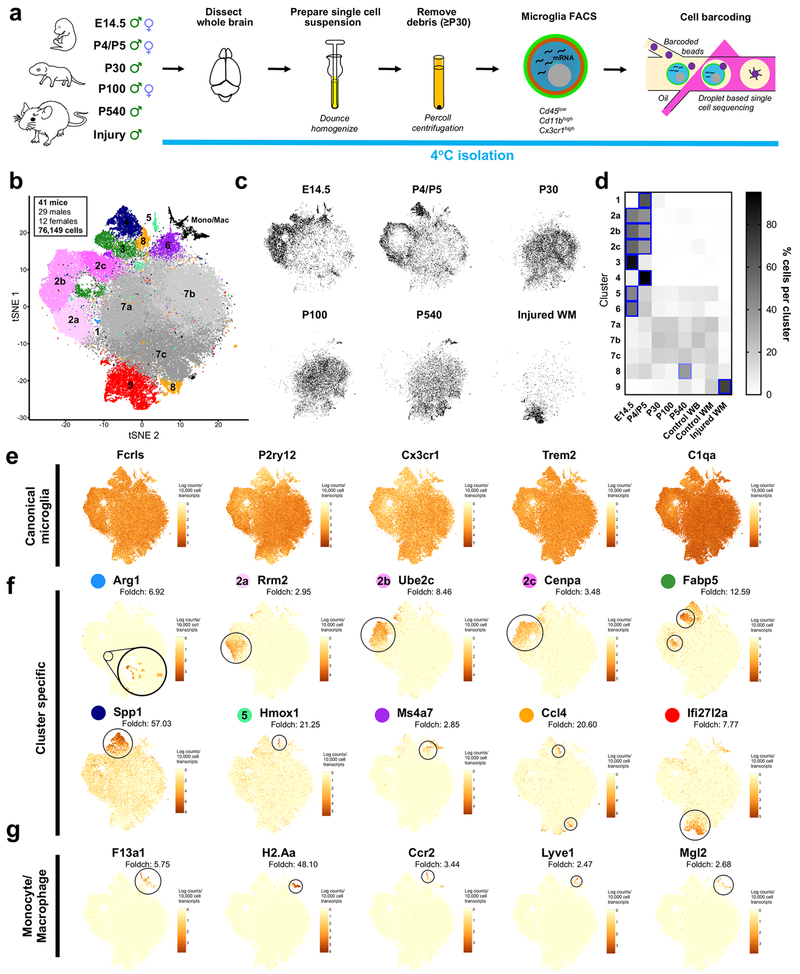
Figure 1. Molecularly distinct subpopulations of microglia peak in number during early development, expand in aging, and emerge following injury. See also Figures S1 and S2.
(a) Microglia were isolated from the whole brains of mice from E14.5 until P540 and from focal demyelinated white matter lesions (Injury). Microglia were isolated under cold conditions to limit ex vivo activation. FACS purified, and single cell sequenced.
(b) tSNE plot of 76,149 cells. In total, nine microglia clusters and one monocyte/macrophage (Mono/Mac)-containing cluster were identified. N=41 mice.
(c) tSNE plots of cells from each age and condition. Only male samples were plotted.
(d) Heatmap of the normalized percent of cells from each sample assigned to each cluster. Blue squares = increase in cells for a given age/condition (P<0.0001). Two-way ANOVA with Tukey’s post-hoc analysis.
(e) tSNE plot colored for expression (log-transformed UMI counts per 10,000 transcripts) of canonical microglial genes.
(f) tSNE plot of expression for genes specifically upregulated in each of the microglial clusters.
(g) tSNE plot of expression for genes specifically upregulated in the monocyte and macrophage cluster.

