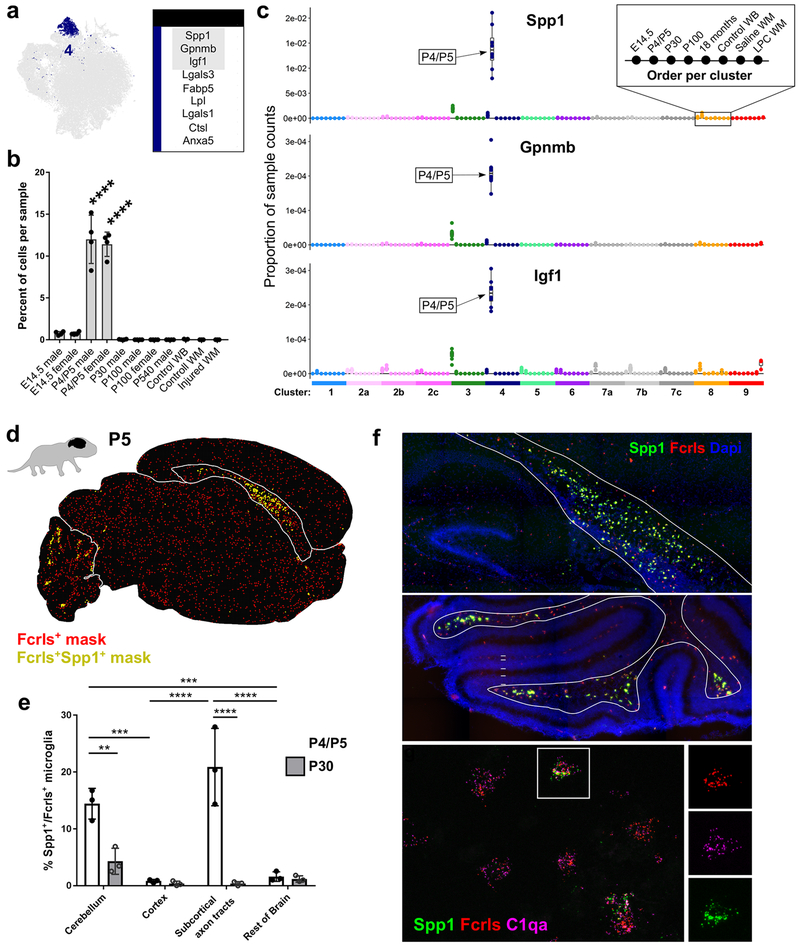
Figure 3. Spp1-expressing axon tract-associated microglia (ATM) densely occupy the early postnatal brain. See also Figures S4 and S5.
(a) tSNE plot of Cluster 4 microglia and a table of the top nine upregulated genes in that cluster. Gray outlined genes are plotted in (c).
(b) Plot of the percent of cells per sample that were assigned to Cluster 4. ****P<0.0001. ANOVA with Tukey’s post-hoc analysis.
(c) Plot of the proportion of normalized UMI counts per sample (summed cell counts) for cells assigned to each cluster for the top genes in Cluster 4. Sample order per cluster is listed in the inset.
(d) Representive image of masked microglia from high-throughput smFISH analysis in a P5 saggital brain section. Fcrls+ only,red or Fcrls+Spp1+ ,yellow. Cbm=cerebellum, Rob=rest of brain, Cc=Corpus callosum, Ctx=cortex.
(e) Quantification of the percent of Fcrls+ microglia that also expressed Spp1 from smFISH analysis. N=3 mice and four brain regions were analyzed. ****P<0.0001, ***P<0.001, Two-way ANOVA, Tukey’s post-hoc analysis.
(f) Images of the P5 cerebellum and subcortical axon tracts of the corpus callosum stained by smFISH. Top two panels were stained with probes Fcrls and Spp1. Nuclei are marked by DAPI. Top panel, Hpc=hippocampus, Cp=choroid plexus, Lv=lateral ventricle, Cc=corpus callosum, Ctx=cortex. Middle panel, Men=meninges, Egl=external granular layer, Pcl=Purkinje cell layer, Igl=internal granular layer, Axtr=axon tracts. Lower panel was stained with probes Fcrls, C1qa and Spp1.. Scale = 200 μm (top panels), 20 μm (lower panel).

