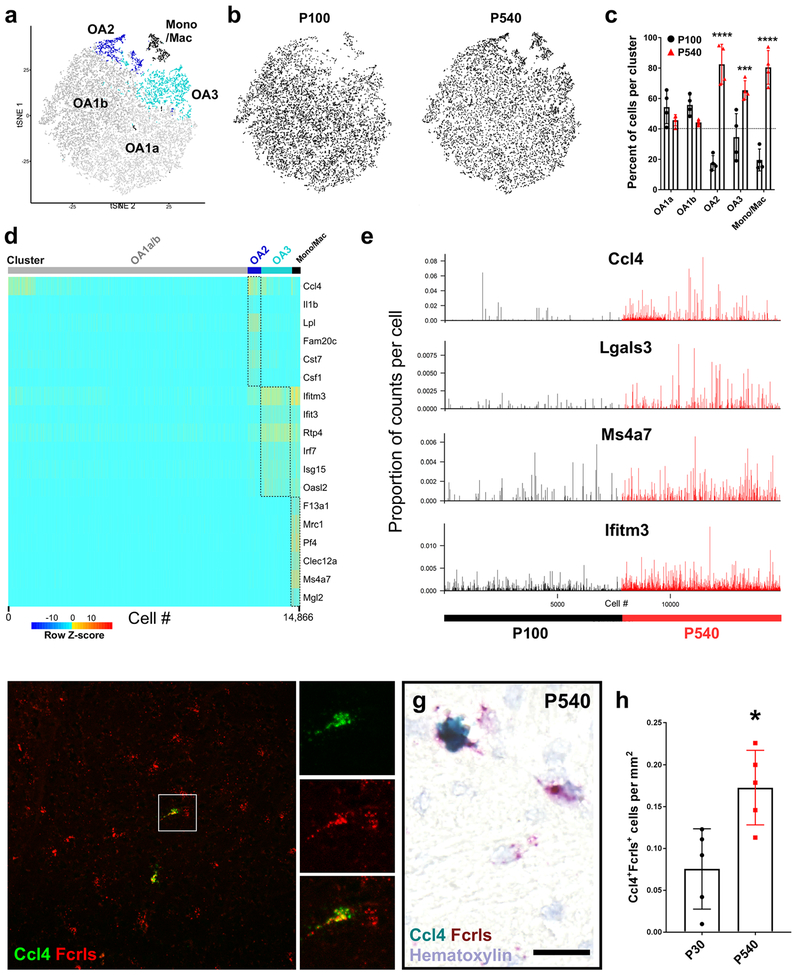
Figure 5. Aging drives varied inflammatory states in microglia subpopulations.
(a) tSNE plot of 14,866 microglia from P100 and P540 (18 month) male mice (n = 4 per age) shows four microglia clusters (OA 1a, 1b, 2, 3) and one cluster of brain border macrophages (Mono/Mac).
(b) Locations of cells from each age on the same tSNE plot as in (a).
(c) Plot of the normalized percent of cells from each cluster derived from each age. ****P<0.0001, ***P<0.001, Twoway ANOVA, Tukey’s post-hoc analysis.
(d) Heatmap of gene expression in each of 14,886 cells in each of the clusters from (a). Plotted genes are some of the top genes for each cluster. Z-score represents the number of standard deviations from the mean following row scaling.
(e) Plot of the number of log-transformed UMI counts per 10,000 cell transcripts in all 14,886 microglia isolated from P100 and P540 samples.
(f) Representative low-magnification flourescent smFISH image of Fcrls+ (red) and Ccl4+ (green) cells in the P540 hindbrain. Scale bar = 25 μm.
(g) Representative high-magnification chromogenic ISH image of Fcrls+ (red) and Fcrls+Ccl4+ (red and turquoise) cells in the P540 hindbrain. Scale bar = 25 μm.
(h) Quantification of Ccl4+Fcrls+ microglia per square millimeter in the P30 and P540 brain. N=5 mice. *P<0.05. unpaired t-test.

