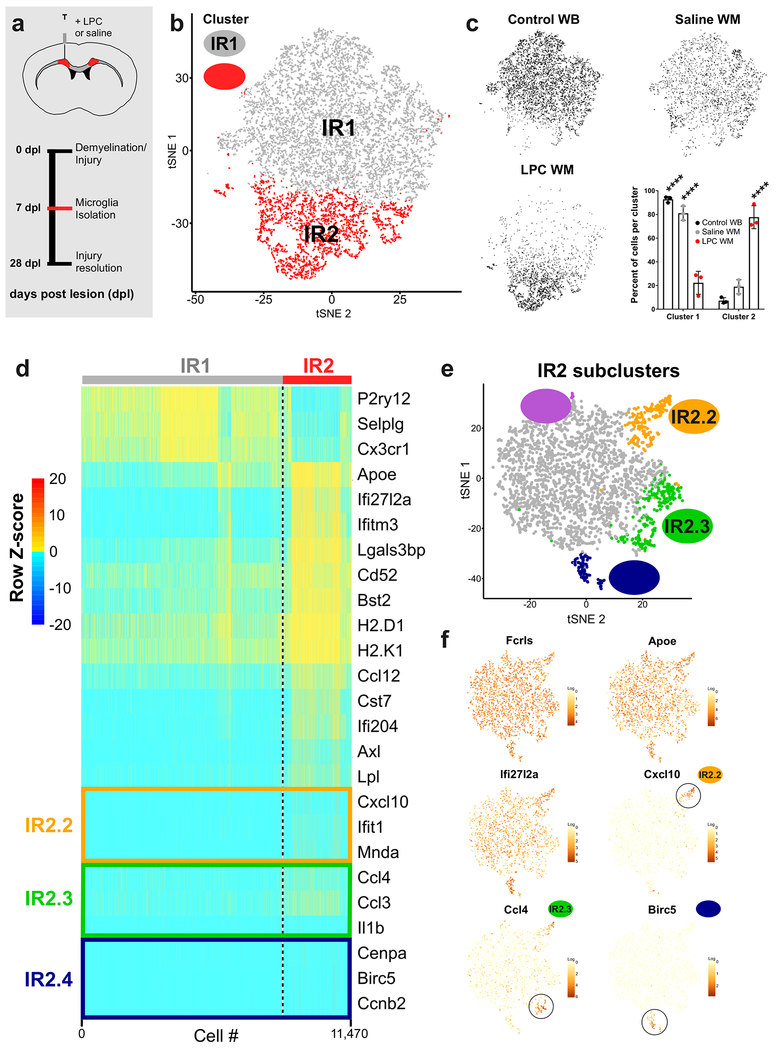
Figure 6. Injury-responsive microglia in demyelinated lesions exhibit multiple activation states. See also Figures S7.
(a) The subcortical white matter of adult mice was injected with the demyelinating agent lysolecithin (LPC) or saline and microdissected after 7 days post lesion/injection (dpl). Microglia were then isolated and sequenced (as is Fig 1a)
(b) tSNE plot of 11,470 microglia from LPC-injected white matter, saline-injected white matter, or whole-brain adult (P100) samples reveals two microglia clusters (IR1, IR2). N=3 mice per condition.
(c) tSNE plots of cells from each condition and a plot of the normalized percent of cells from each sample assigned to each cluster. ****P<0.0001, Two-way ANOVA, Tukey’s post-hoc analysis.
(d) Heatmap of gene expression in each of 11,470 cells in each of the clusters from (b). Plotted genes were grouped by genes that were downregulated (P2ry12, Selplg, Cx3cr1) in Cluster IR2 or those that defined each of the subclusters in Fig. 6e. Z-score represents the number of standard deviations from the mean following row scaling.
(e) Cells from Cluster IR2 were subclustered to identify different subpopulations of activated microglia. tSNE plot shows four subclusters of Cluster 2 microglia (2.1-2.4).
(f) tSNE plots of subclustered cells colored for expression (log-transformed counts per 10,000 transcripts) of genes that were expressed by the majority of Cluster IR2 microglia (Fcrls, Apoe, Ifi27l2a), or Cluster IR2 subpopulations (Ccl4 (IR2.3, IR2.3), Cxcl10 (IR2.2), and Birc5 (IR2.4).

