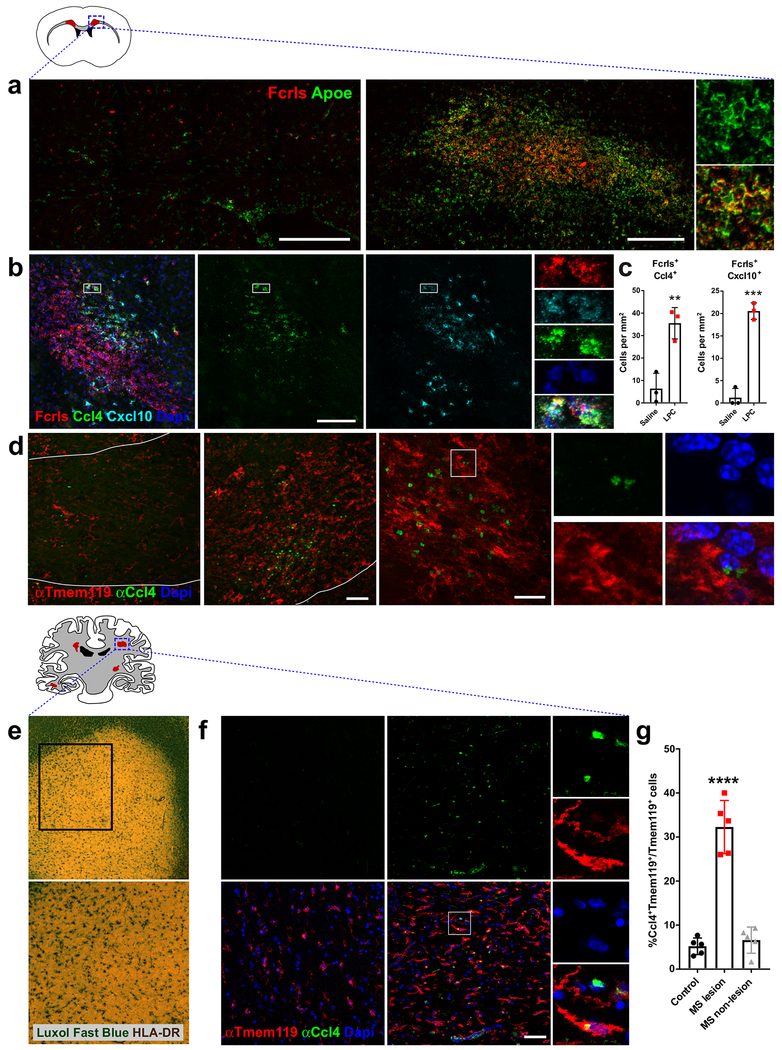
Figure 7. Different subpopulations of activated microglia are found in spatially restricted areas of mouse demyelinated lesions and human MS lesions.
(a) Confocal images of saline- and LPC-injected white matter in adult mice stained by smFISH for the microglial probe Fcrls and activation marker Apoe. Str=striatum, Cg=cingulum, Lv=lateral ventricle, Cc=corpus callosum. Injection site/lesion outlined with white dotted line. Scale bar = 250 μm.
(b) Confocal image of LPC-injected demyelinated lesion stained by smFISH for the probes Fcrls, Ccl4, and Cxcl10. Scale bar = 100 μm.
(c) smFISH quantification of the percent of Fcrls+ microglia in saline- and LPC-injected white matter that co-expressed markers Ccl4 and Cxcl10. N=3 mice, ***P<0.001, **P<0.01, unpaired t-test.
(d) Confocal images of saline- and LPC-injected white matter stained with antibodies to recognize Ccl4 and resident microglia marker Tmem119. Left scale bar =50 μm, right scale bar=20 μm.
(e) Low-magnification images of demyelinated active MS lesions stained with Luxol Fast Blue (myelin) and anti-HLADR antibody (microglia/immune cells).
(f) Confocal images of control and human MS white matter stained with antibodies to recognize Ccl4 and resident microglia marker Tmem119 and DAPI+ cell nuclei. Scale bar = 50 μm.
(g) Quantification of the percent of Ccl4+Tmem119+ microglia in control patients, active MS lesions, and unaffected white matter in MS patients. N=5 patients per condition, ****P<0.0001, one-way ANOVA, Tukey’s post-hoc analysis

