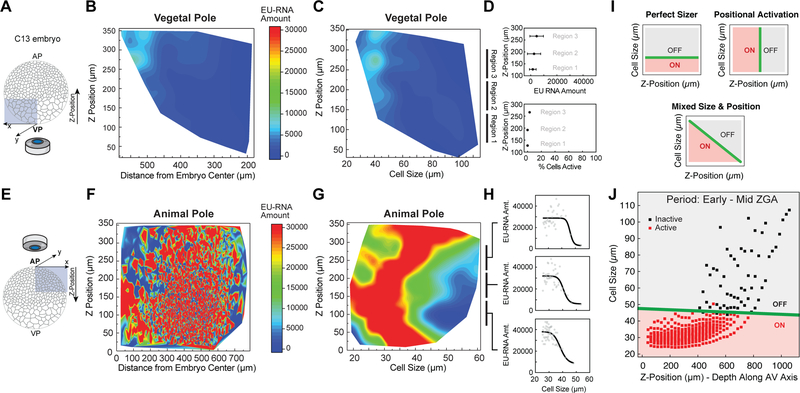
Figure 4. A Cell Size Threshold, Not Spatial Position, Dictates ZGA Onset.
(A and E) Schematic of confocal imaging of the vegetal pole (VP) (A) and animal pole (AP) (E) in embryos at ~ C13. Z-position along the AV axis in the indicated directions.
(B, C, F and G) Heatmap contour plot of nuclear EU-RNA amount as a function of z-position and distance from embryo center within the vegetal pole (B) and animal pole (F), and of z-position and cell size within the vegetal pole (C) and animal pole (G). Color scales indicate low (blue) to high (red) transcription.
(D and H) EU-RNA amount and percent of transcriptionally active cells as a function of z-position within the indicated sub-regions of the vegetal pole (D) and animal pole (H).
(I) Predicted decision boundaries for ZGA with a perfect sizer (top), positional bias (middle) and mixed sizer and positional effect (bottom). Gray, inactive; red, active; green line, decision boundary for ZGA.
(J) Logistic regression boundary decision for ZGA as a function of cell size and z-position along the AV axis. Each point is a bin of 25 μm by z-position followed by a bin of 250 cells for each of 8 embryos at ~ C12.8-C13.5. Binary activation based on threshold amount EU-RNA. Black square, inactive cells; red square, active cells; green line, decision boundary.
See also Figure S4.

