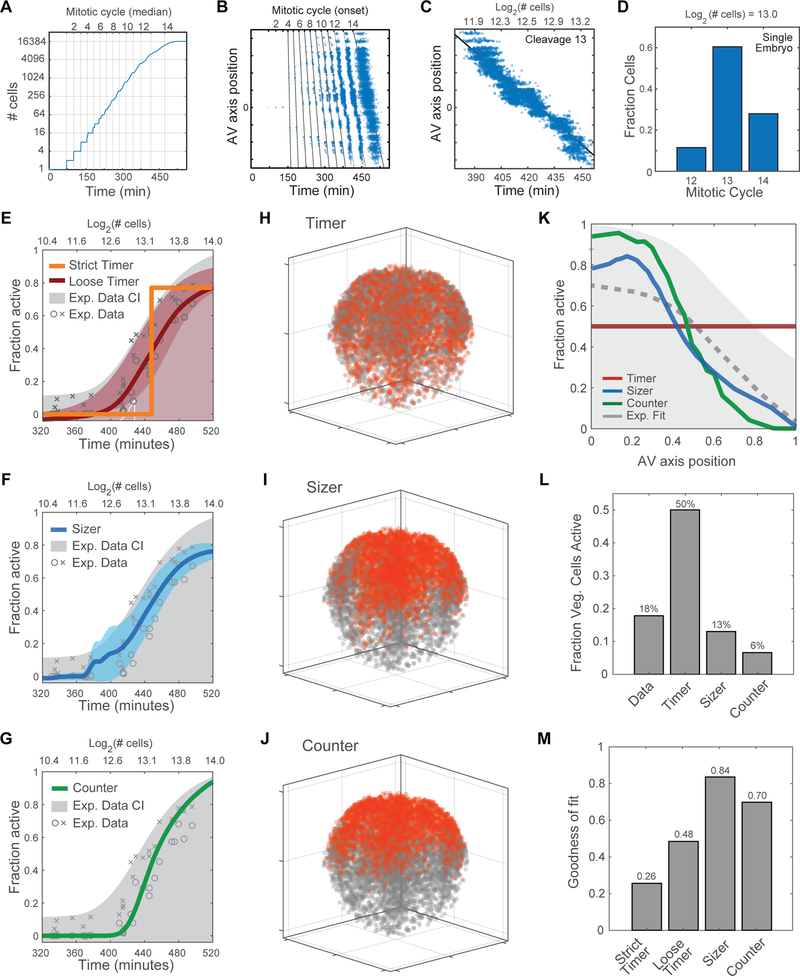
Figure 5. Computational Model for Characterization of Zygotic Genome Activation.
(A) Developmental progression in silico: showing relationship between cell number, rounds of division (mitotic cycle) and time elapsed since fertilization.
(B) Successive mitotic waves generate asynchrony, resulting in an increase in the phase delay between the division of the first cell (on animal side) and the division of the last cell (on vegetal side).
(C) Delay of up to 80 minutes (2+ rounds of division), between onset of 13th division in cells at the animal pole and cells at the vegetal pole.
(D) A single embryo at ~ 8,000-cell stage contains a mixture of cells that have undergone 12, 13 or 14 divisions. Cell that have undergone more divisions are located in the animal pole.
(E-G) Predicted timing of ZGA onset for computationally simulated models compared to experimental data and confidence interval (CI).
(E) ‘Strict Timer’ (orange line) poorly fits experimental data (gray) (R2 = 0.758); ‘Loose Timer’ model (red line + confidence interval) better fits the experimental data (R2 = 0.96).
(F) Cell Sizer model (blue line + confidence interval) and experimental data (gray) (R2 = 0.959).
(G) Cell Cycle Counter model (green line + confidence interval) and experimental data (gray) (R2 = 0.939).
(H-J) Predicted spatial patterns of ZGA for an embryo in early ZGA (~ 9,000 cells, log2 = 13.1), based on timer, sizer, and counter models. Activated nuclei (red) and inactive nuclei (gray).
(H) Timer model 3D prediction: inaccurately predicts ZGA in the vegetal cells.
(I-J) Sizer model predicts a 3D spatial pattern of ZGA similar to the experimental data.
(J) Counter model predicts a 3D spatial pattern of ZGA similar to the experimental data.
(K) Predicted fraction of activated cells along the AV axis. Comparing experimental data (gray dotted line and confidence interval) vs. computationally simulated models: timer (red), sizer (blue), counter (green).
(L) Fraction of cells active in the vegetal pole in a 9000-cell embryo, comparing computational models to experimental data. Timer model incorrectly predicts high activity in vegetal region.
(M) Error of fit for model predictions to experimental data in subplot Figure 5K.
See also Figure S5.

