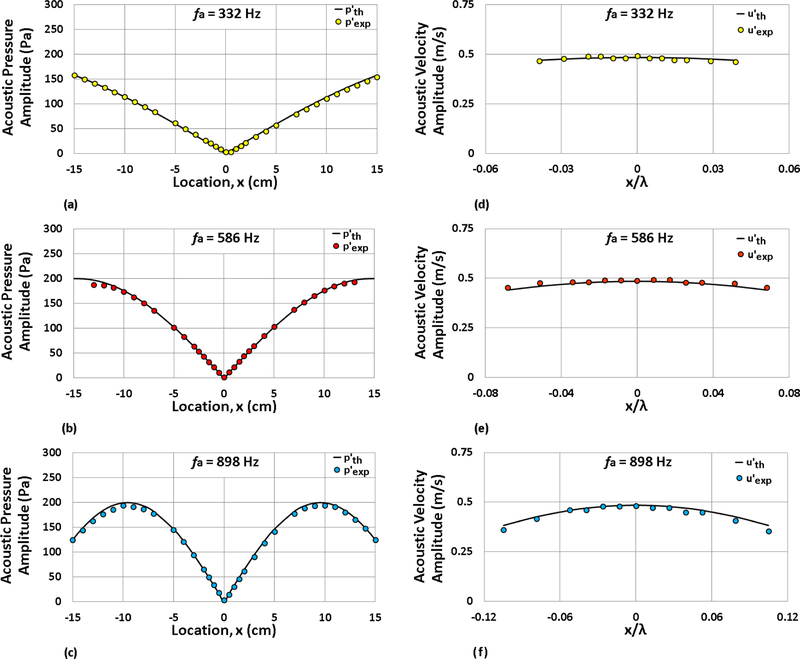
Figure 2:
Experimental and theoretical acoustic pressure perturbation amplitude profiles (at locations x/λ within the waveguide) are shown at forcing frequencies (a) 332 Hz, (b) 586 Hz, and (c) 898 Hz. The maximum pressure amplitude at the nearest PAN was = 200 Pa. Corresponding experimental and theoretical acoustic velocity perturbation amplitude profiles are shown at forcing frequencies (d) 332 Hz, (e) 586 Hz, and (f) 898 Hz for = 200 Pa.

