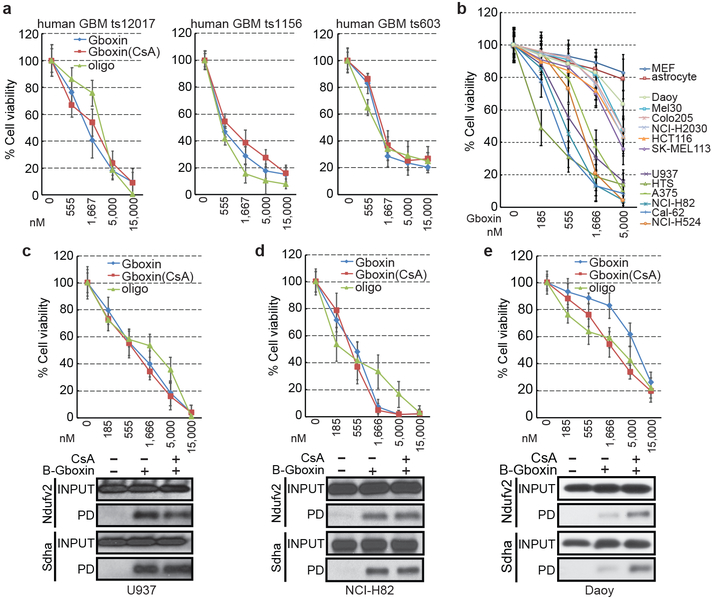
Figure 5. Gboxin toxicicity on primary human GBM cells and tumor cell lines.
a. Gboxin inhibition of three primary human GBM cell cultures harboring different mutational spectra (ts12017, ts1156 and ts603; see Methods for details) treated with increasing doses of oligomycin A or Gboxin in the presence/absence of CsA (1 μM). n=3. Mean ± SD. b. Gboxin toxicity in multiple human cancer cell lines compared to resistant primary MEFs and astrocytes. All cells tested with the exception of Daoy cells demonstrate a therapeutic index. Mean ± SD; n=3. c-e. Top panels (Mean ± SD): Cell viability assays for Gboxin sensitive U937 & NCI-H82 (c,d), and resistant Daoy (e; IC50: 8,256 nM) human cancer cells treated with increasing doses of oligomycin A or Gboxin in the presence/absence of CsA (1 μM). Daoy cells acquire sensitivity in the presence of CsA (IC50: 1,867 nM). Bottom panels: Western blot images for OxPhos proteins from pull down assays using cells treated with B-Gboxin in the presence/absence of CsA (1 μM). Resistant Daoy cells acquire enhanced OxPhos protein interaction with B-Gboxin only in the presence of CsA. n=3.

