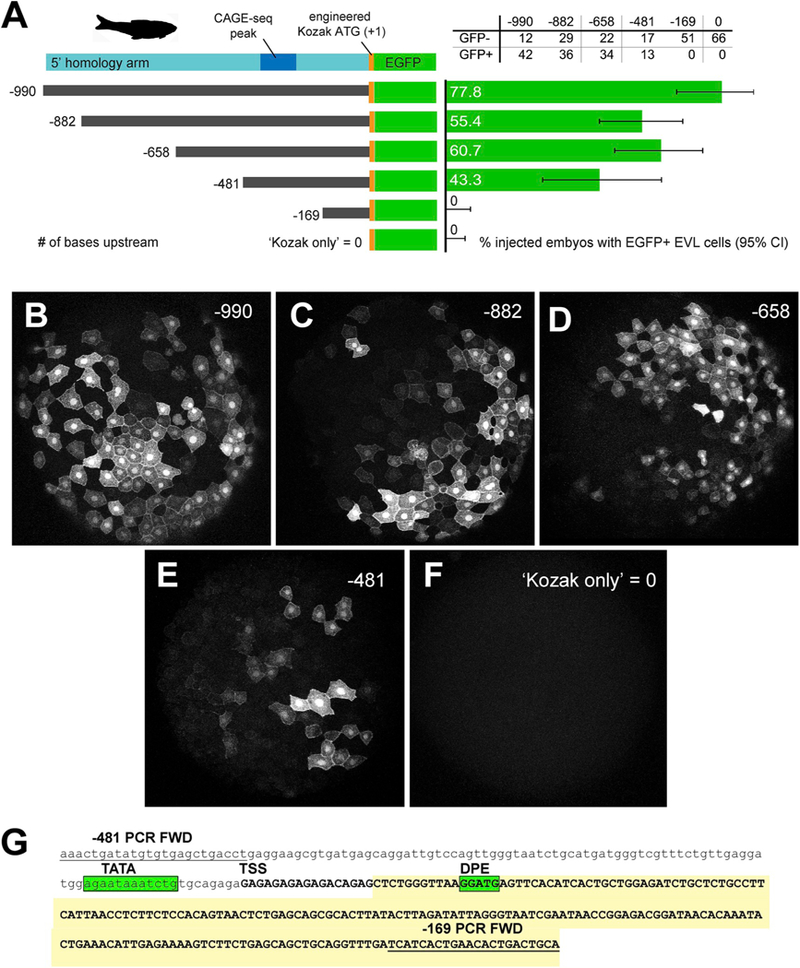
Fig. 9.

In vivo validation of zebrafish first intron promoter and enhancer activity.
A. LEFT: 5’ deletion series of the zebrafish 5’ homology arm upstream of the transgenic cassette (lcp1:Cre-P2A-EGFP-CAAX, abbreviated ‘EGFP’). Constructs are numbered according to the number of bases upstream of the engineered translation start site (ATG, where A = +1.) A. RIGHT: Results of deletion-series injections. Green bars = proportion of injected embryos with EGFP + EVL cells. Gray lines = 95% confidence interval on the proportion.
B-F. Animal cap views of injected, EGFP + embryos collected at 50% epiboly.
G. Annotation of the minimal intronic region (−481 to −169) sufficient for EVL activity. The deletion-construct forward PCR primers are underlined. The predicted transcript is in UPPER CASE. TATA = TATA box motif; TSS = transcription start site; DPE = downstream promoter element. The EST ‘foothill’ (See Figs. 7 and 8) is shaded yellow.
