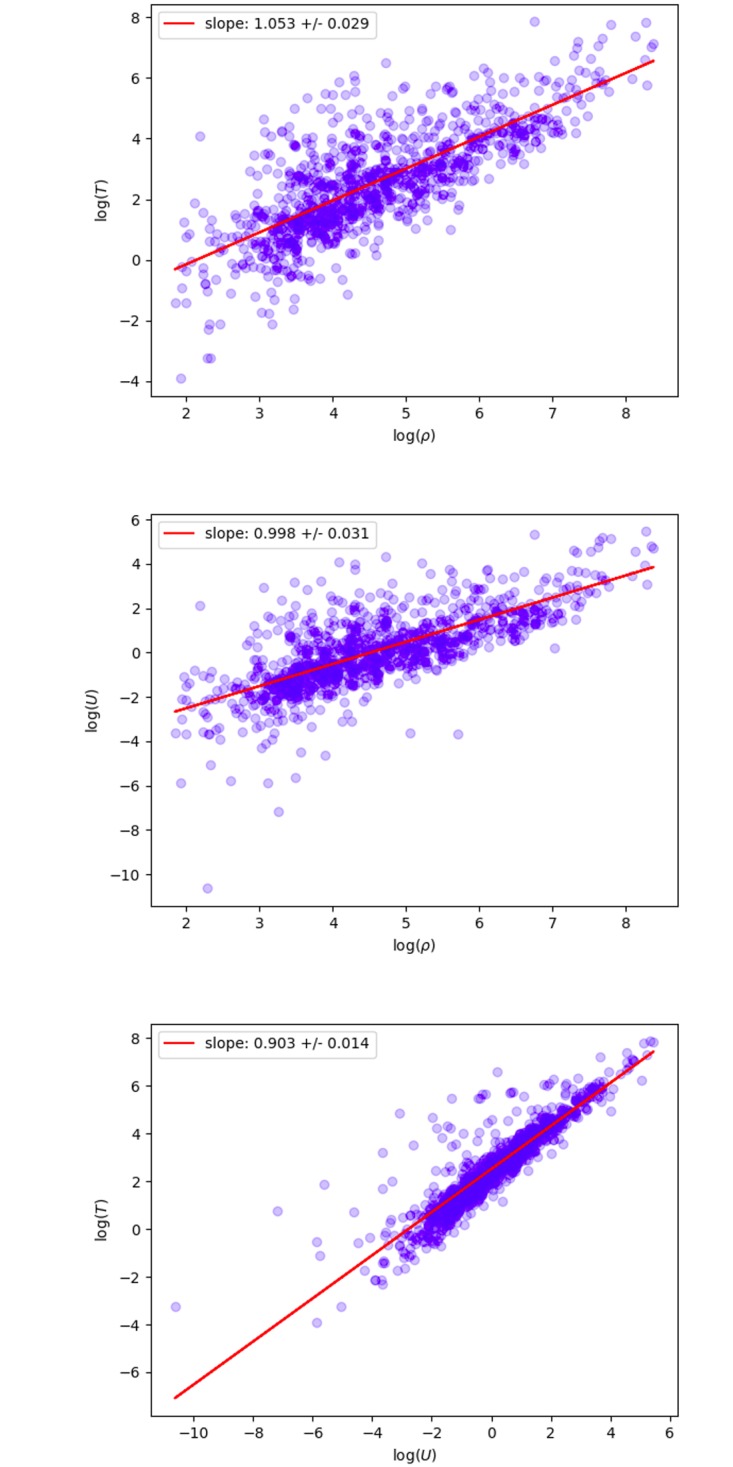
Fig 3. Scaling laws for geo-tagged tweets.

Left: Tweet density T versus population density ρ, slope of the line is α. Middle: User density U versus population density ρ, slope of the line is β. Right: Tweet density T versus user density U, slope of the line is γ. Using a 40 × 40 grid.
