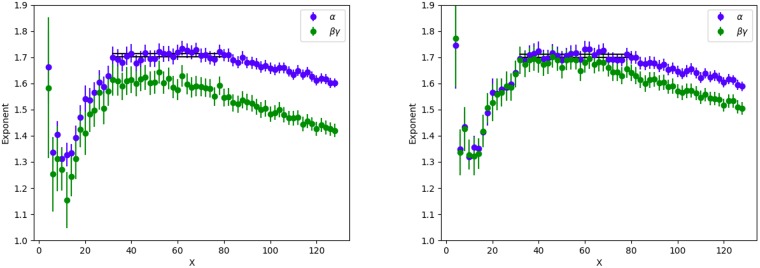
Fig 5. Consistency relation check.
Left: Comparing the exponent α obtained from fitting the data to βγ using all the place-tagged tweets. Right: Comparing the exponent α obtained from fitting the data to βγ using only users with at least 10 place-tagged tweets during the data collection period. Black line is the average of α across grid sizes from X = 32 to X = 80.

