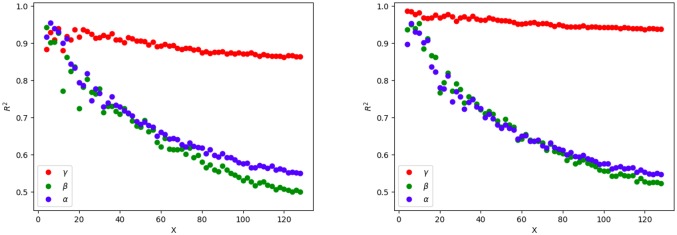
Fig 7. Fit quality check.
Coefficient of determination R2 for each fit of the data to Eq 3 across a range of grid sizes. Left: Fits using all place-tagged tweets. Right: Restricting the fits to users with at least 10 tweets. Tweet density T is very well predicted by user density U. Across the scaling window from X = 32 to X = 80, between 75% and 60% of the variance in T and U is predicted by population density ρ.

